As IT professionals, we often make assumptions based on our years of experience using computers. But we all know what they say about assumptions. Real data enables us to make better decisions, and not fall back on the assumptions we hold true.
Naming the top 10 applications used by students in our teaching laboratories may look like a trivial exercise, however it is just a little piece of our journey to better understand how IT services are consumed.

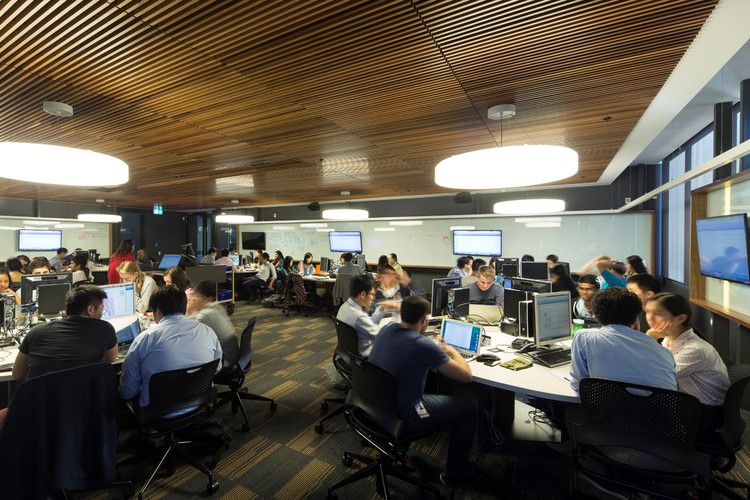
UNSW IT has many tools in place to measure application usage in the labs. In the last year, we’ve been able to include real-time application usage, greatly improving the stats we can provide. During Semester One, 2016 we systematically collected data about more than two hundred and sixty different applications on almost two thousand lab computers, used by around twenty thousand students.
The top 10 applications were:
1 Google Chrome
2 Microsoft Word
3 Adobe Acrobat
4 Microsoft Excel
5 Safari
6 Microsoft Internet Explorer
7 Mozilla Firefox
8 Microsoft PowerPoint
9 Adobe Photoshop
10 Matlab
The top ten reveals some interesting patterns in itself. Four of the top ten applications are web browsers, three from the Microsoft office suite — are we seeing the battle of traditional desktop applications versus cloud applications playing out here? Only two specialised apps, Photoshop and Matlab, make the list.
Of course the ability to quickly reveal this type of information is just the tip of the iceberg. There are more interesting business questions we expect to answer with the analytical capabilities we are building. Analysing this growing dataset give us insights about the different demand patterns across faculties and help us to identify spare capacity at certain times or areas. This rising knowledge is already helping us to design better services and learning spaces.
That is part of our constant search for opportunities to create great value for the UNSW community.
4 comments on “Measuring the Top 10 applications used by UNSW students”
I should have specified the UNSW WI FI
Our networks/security teams can measure traffic between devices and specific internet domains. We could use this data to have an insight about which apps are generating traffic. I believe that was the case described on the previous “pokemon go” post. However notice some applications could be highly used and generate none or minimal internet traffic, so we need be careful knowing this method has some limitations.
Would it be possible to measure application use via WI FI? That would give us a really good picture of what applications the students are using.
Good question! Wifi usage would be a little different because it would be student owned devices, but networks certainly measures traffic to services..