
By William Thackway & Christopher Pettit, City Futures Research Centre
There are many new challenges facing our cities and regions brought upon by the COVID-19 pandemic. These include the impact of global mobility and multiple prolonged lockdowns restricting interstate travel since the pandemic reached Australia in March 2020. Consequently, for the year ending December 2020, the number of international visitors to Australia dropped by 80% from 8.7 million tourists in 2019 to 1.7 million in 2020. Concurrently, domestic overnight visitors have fallen by 38% from 117 to 73 million trips. However, while the foreseeable outlook for international travel is bleak, domestic tourism has experienced a comeback, with domestic travel figures for the end of 2020 nearing 2019 rates. So, who have been the winners and losers of this changing travel landscape?
To investigate how travel patterns have shifted within Australia, we looked at changes in Airbnb activity in major tourist areas. Using data acquired from the web scraping company AirDNA, we compared changes in the total number of Airbnb listings at an SA2 level between 2019 and 2020 in Australia’s capital cities and major regional tourist hotspots. These patterns elucidated a shift away from urban tourism and towards regional travel.
Figure 1: Changes to Airbnb count in Australia’s capital cities between 2019 and 2020
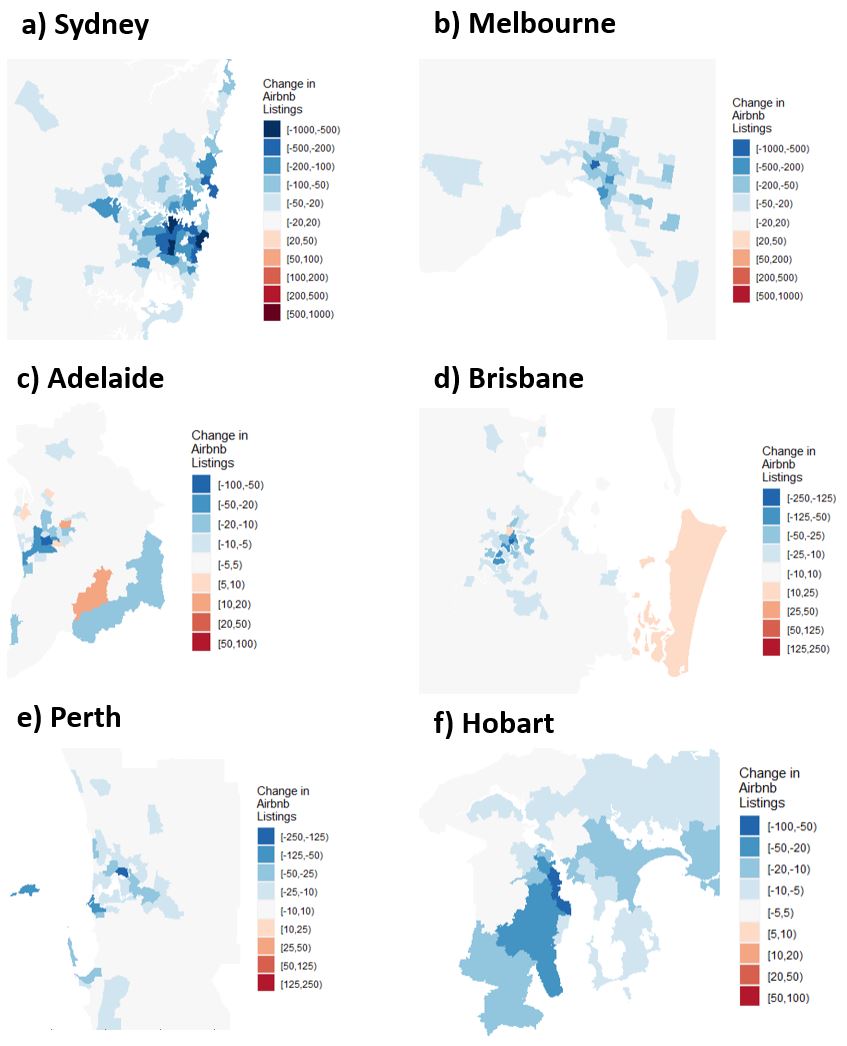
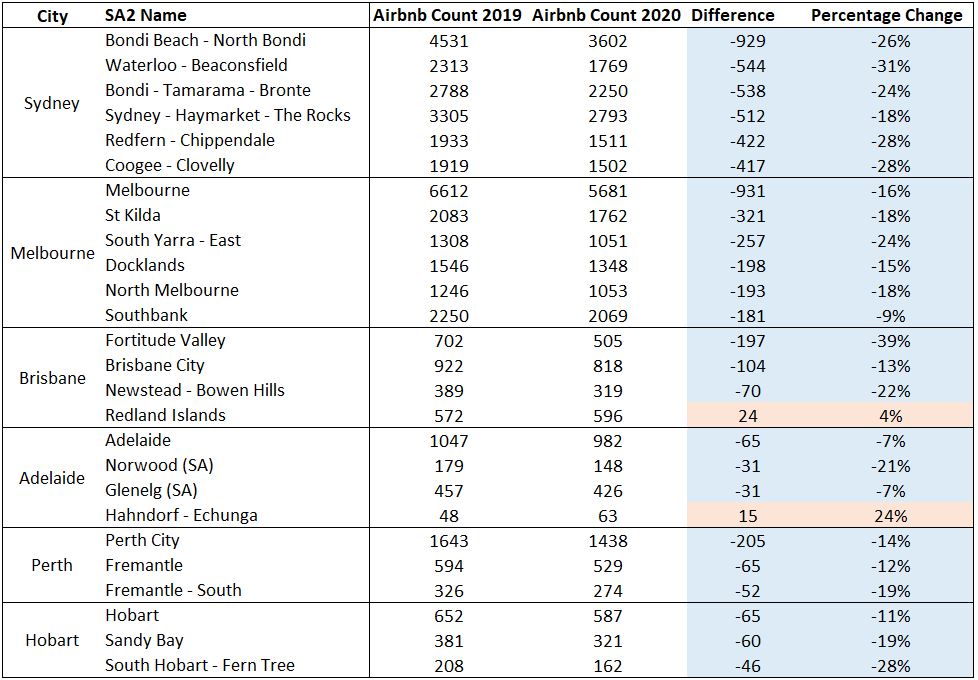
Figure 1 illustrates changes to Airbnb activity pre- and post-COVID in Australia’s six capital cities. Table 1, meanwhile, documents the hot-spot and cold-spot SA2 areas in terms of changes in Airbnb listings. Starting with Sydney in Figure 1(a), there has been a substantial decline in Airbnb listings throughout the entire city, with all active Airbnb areas experiencing a reduction in tourist numbers. The most substantial impacts were felt in Sydney’s tourist hotspots towards the CBD and eastern suburbs, with close to 1000 listings lost in Bondi. Similarly in Melbourne (Figure 1(b)), both a reduction in the range and intensity of Airbnb activity is evident throughout the city. Whilst the loss of Airbnb’s is less widespread than in Sydney, the most intense reduction of 931 listings in the Melbourne CBD is roughly equivalent.
There is a similar story for Perth and Hobart, both experiencing declines in Airbnb listings for all SA2 areas. Once again, the most concentrated effects of the pandemic on tourism are felt in the central tourist hotspots, with the magnitudes varying from up to 200 in Perth to 60 in Hobart. In Brisbane and Adelaide, while tourist numbers have still overwhelmingly reduced, there is some bucking of the trend of a unilateral decline in Airbnb activity. In Brisbane, the popular coastal retreat of the Redland Islands have marginally increased their Airbnb activity, and in Adelaide there has been a bump in listings in several periphery suburbs towards the south- and north-east.
Table 1: Table of hot-spot and cold-spot SA2 areas within capital cities
Across the capital cities there are several consistent trends that can be explained by the changing travel patterns brought on by the COVID-19 pandemic. Firstly, the intensity of reductions in Airbnb listings are roughly proportional to the intake of international travellers for each city. Intuitively this makes sense: the more international tourists a city has, the more it must lose when international travel is shut down. Sydney and Melbourne are Australia’s two largest tourist destinations, intaking 4.1 and 2.9 million international tourists respectively in 2019. Correspondingly, both exhibited the most concentrated reductions in Airbnb listings, with Sydney particularly experiencing significant declines in several different tourist hotspots. The magnitudes of reductions in Airbnb listings for the other capital cities then nearly mirror international tourist numbers, with Perth (0.9 million international tourists annually) leading Brisbane (1.4 million), Adelaide (0.4 million) and Hobart (0.3 million). Interestingly, Perth seems to have ‘outperformed’ its relative international tourist market in terms of Airbnb listings lost, which might be explained by the prolonged state border closure, lasting March – November, that restricted interstate travel to WA.
Another trend across all capital cities is the concentration of reduced Airbnb activity towards central areas. This aligns with urban tourism literature, that documents the clustering of urban tourism in central localities, due to proximity to tourist attractions, restaurants and entertainment, and better access to transport (Ashworth & Page, 2011; Garcia-Hernandez et al., 2017). Therefore, it is expected that an overall decrease in tourist numbers will affect central areas most prominently. However, the idiosyncratic cases of Airbnb listing increases towards the outskirts of Brisbane and Adelaide raise the question of whether there is another factor at play reducing central tourism. In the wake of several prolonged city lockdowns, is there an increased desire for domestic travellers to escape the city and head to regional areas?
Figure 2: Changes to Airbnb count in selected regional hotspots between 2019 and 2020

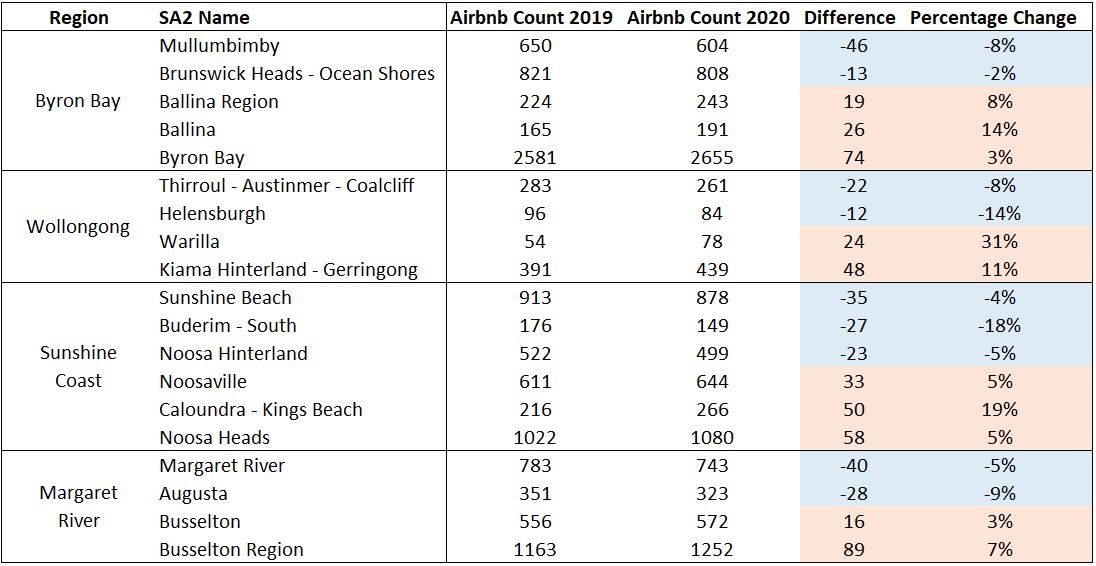
Figure 2 examines changes to Airbnb listings in prominent regional hotspots in several states, while Table 2 gives specific hot-spot and cold-spot SA2 areas. In the northern NSW coastal area of Byron Bay (Figure 2(a)), the visual distribution of Airbnb listings has remained stable, while tourist numbers are predominantly up. The most popular tourist destination in the area, Byron Bay itself, expanded its tourist presence with over 70 new Airbnb listings. Similarly in Wollongong and its surroundings, a popular tourist area 2 hours south of Sydney, Airbnb listings have increased overall. Once again, the greatest increase of close to 50 new Airbnb listings is evident in the area’s most popular tourist getaway of Kiama.
Margaret River (WA) and the Sunshine Coast (Qld) both exhibit a mixture of increases and decreases in Airbnb listings. However, in both cases, the number of increased listings outweigh the reductions, translating to an overall growth in tourist numbers in these areas. Consistent with other regional tourist hotspots, Airbnb listings grew most in the most popular tourist areas.
Table 2: Table of hot-spot and cold-spot SA2 areas within regional tourist areas
Hence, in contrast to the major cities, regional tourist hotspots have enjoyed an increase in tourist numbers in response to the COVID-19 pandemic. While urban centres have experienced the worst declines of Airbnb presence, listings in regional centres have soared. The implications of these changing travel patterns for future Australian tourism are two-fold.
Firstly, international tourists have a higher propensity to visit capital cities than regional areas, therefore the disruption of global travel has affected urban tourism far more significantly than regional tourism. International tourists will eventually return, meaning we might expect this pattern to reverse. However, in the wake of extended lockdowns and stifled international travel, domestic travellers have shown an increasing preference towards regional and coastal tourism over travel to other major cities. Brian Chesky, CEO of Airbnb, earlier this year predicted a long-term shift towards domestic and regional travel, as people seek less sightseeing and more meaningful travel. Certainly, on the basis of our analysis, this holds true for the past year and a half in Australia. However, whether this response to the COVID-19 pandemic truly represents a shifting tide in Australian tourism, or merely an adaptive short-term solution, remains to be seen.
References:
- Abril D (2021), Airbnb’s CEO on how COVID has changed travel forever. Available at: https://fortune.com/2021/01/14/airbnb-brian-cheskys-future-of-travel-predictions-coronavirus-pandemic/.
- Ashworth G and Page SJ (2011), Urban tourism research: Recent progress and current paradoxes. Tourism Management, 32 (2011), pp. 1-15.
- Australian Government Austrade (2021), International Visitor Survey Results December 2020. Available at: https://www.tra.gov.au/data-and-research/reports/international-visitor-survey-results-december-2020/international-visitor-survey-results-december-2020.
- Australian Government Austrade (2021), National Visitor Survey Results December 2020. Available at: https://www.tra.gov.au/data-and-research/reports/national-visitor-survey-results-december-2020/national-visitor-survey-results-december-2020.
- Garcia-Hernandez M, de la Calle-Vaquero M and Yubera C (2017), Cultural Heritage and Urban Tourism: Historic City Centres under Pressure. Sustainability, 9 (2017), pp. 1346-1365.
No Comments so far ↓
There are no comments yet...Kick things off by filling out the form below.