Interviewed by Sara Loo
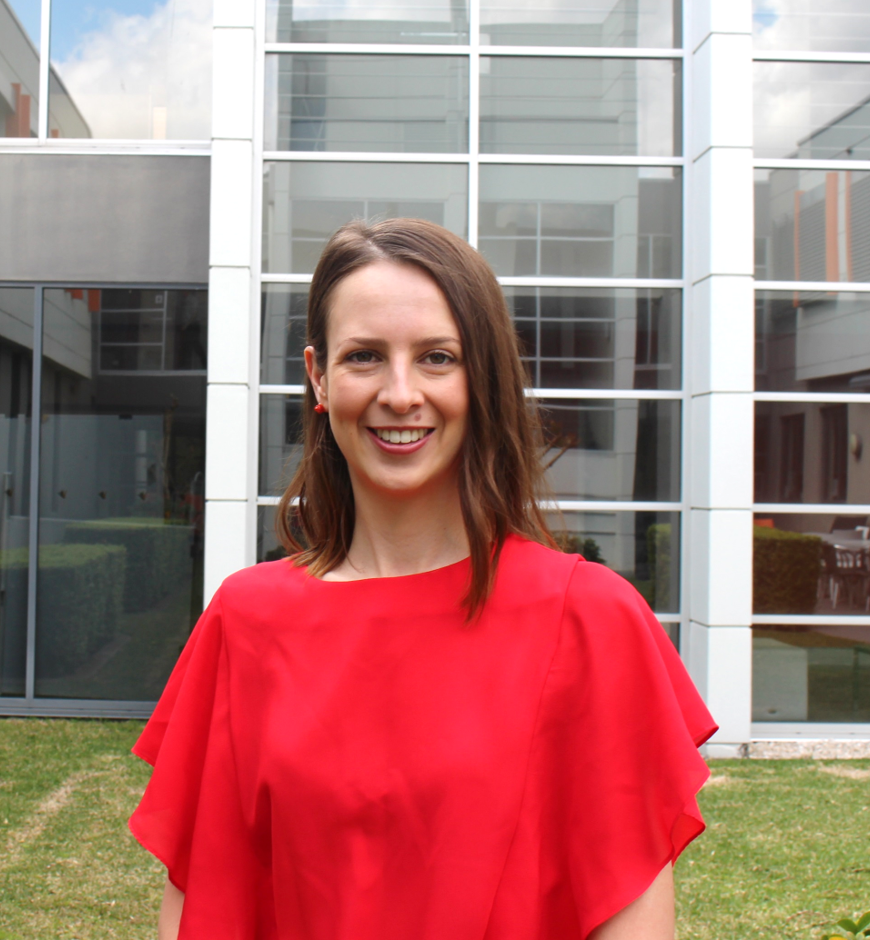
Joanne Beames is currently a post-doctoral researcher and clinical psychology registrar at the Black Dog Institute. She is passionate about seeing results come out of the work she does with school students. As one of our ECR cohort, we chatted to her about how new technologies can help youth mental health, and what she loves about psychology.

You work at the Black Dog Institute. What is the focus there?
The Institute is the only medical research institute in Australia that is all about improving the mental health of people of all ages.
We’re working in the early detection, prevention and treatment space for common mental health disorders, like depression and anxiety. There’s a big focus on bridging the gap between research and practice to increase the delivery of effective mental health strategies to the people that need them, when they need them. This is one of the main reasons why I like working at the Institute. I think that equitable access to evidence-based treatments that work is a really important cause to contribute to.
Using e-health technology is one of the ways that we are trying to increase the availability of mental health care options for people in Australia, and worldwide. There are so many benefits and opportunities for using technology in mental health, like increased access and reduced cost, but we don’t really know much about how to do this in a way that maximises outcomes for the people that use them.
To address this gap, a lot of our work aims to improve the implementation of e-mental health services and programs in real-world contexts. In my work specifically, I look at how to best use e-health technology to prevent mental illness in young people.
What is “e-mental health technology”?
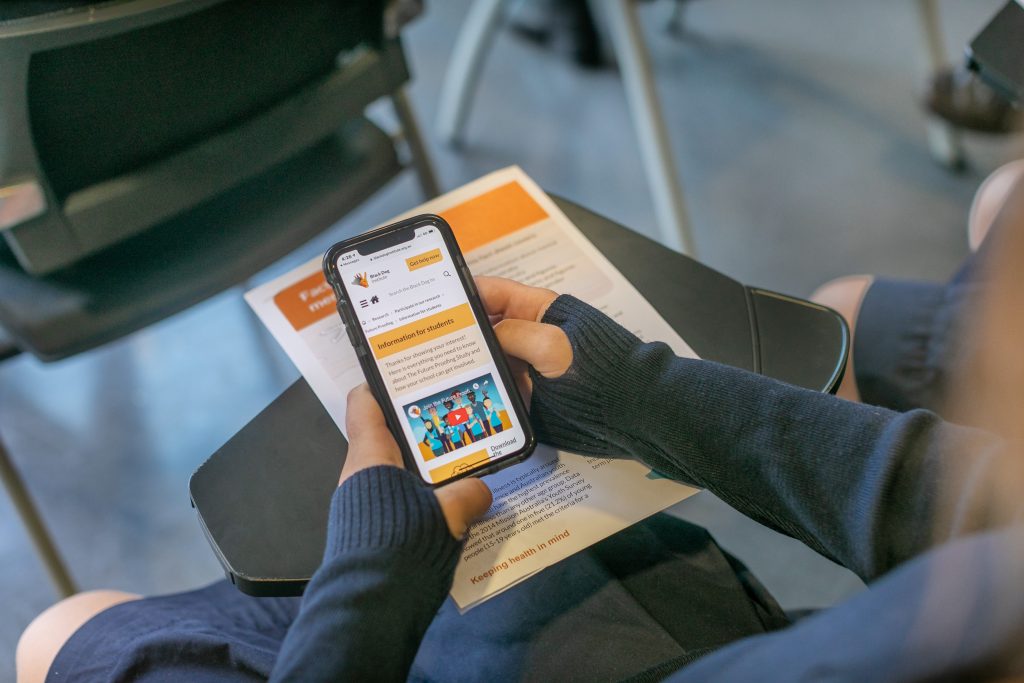
E-mental health technology just means any mental health service or program that is delivered using technology. The program could be delivered via a website, phone app, or a sensor-based monitoring device such as a smart watch.
I look at the school-based delivery of prevention programs to young people using smartphone apps. Because most young people have a phone, they are a great way to reach lots of young people at once, regardless of their location. They help to overcome other barriers of face-to-face therapy, like high cost, embarrassment, and stigma. They also help to increase engagement by building the sense of autonomy that young people have in their own mental health care – autonomy is really important for this age group.
Can you tell us a bit about your research?
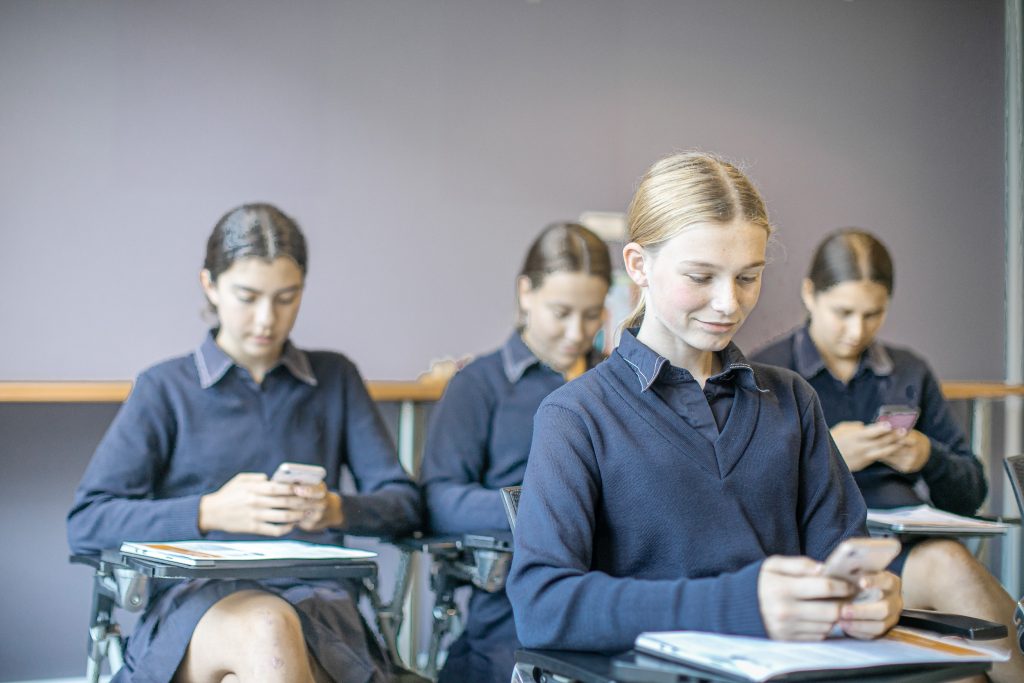
I am evaluating whether, and how, a depression prevention app can be implemented at scale in Australian schools. We hope to reach at least 10,000 Year 8 students from a range of schools – public, private – and areas across Australia – rural, regional, and metropolitan. Schools are an ideal environment to implement prevention programs because they provide access to large numbers of young people, at the developmental phase when mental illness first emerges. School staff who have a mental health role, such as counsellors, well-being officers, and teachers, are responsible for supporting the delivery of the app to students.
Information from my research will help to maximise how much young people engage with and use the app and, in turn, preventative effects on depression. It will also inform how mental health prevention technologies can be disseminated at scale in schools, in a way that is sustainable over time.
How do you explore the implementation of the prevention app in schools?
I’m interested in the factors that help school staff to support the delivery of the app in their school. I’m equally interested in the factors that make it difficult for them to do so. I use surveys and interviews to explore how staff perceive the app, as well as their experience with supporting its delivery. Because schools are complex environments and staff are often time-poor, we expect that the delivery is going to vary across schools. This means that staff might provide different levels and types of support across different schools, which will affect student adherence and, in turn, their mental health outcomes.
You interact with a lot of young people, who your research focuses on. What do you enjoy about that?
I think that working with young people is really important in the mental health space. Given that many mental health problems first emerge during early adolescence, prevention and early intervention efforts at this time are critical for improving their trajectory.
I also think that young people can be extremely resilient, and their ability to cope in the face of multiple stressors and major life transitions is inspiring. For me, seeing how young people can respond to mental health strategies is a source of hope.
What drew you to study psychology? And why research in particular?
Psychology was a good fit for me because I was interested in why people feel and do the things that they do. I initially wanted to work as a clinical psychologist rather than a researcher, but during my postgraduate studies I quickly saw how important it was to be a scientist-practitioner. So now I do both! This means that I use gold-standard evidence to guide what I do with clients during psychological therapy, and also use insights from working with clients to guide the types of questions I explore in my research.
I was also drawn to research because there is still so much that we do not know about mental illness – the causes, the individual risk factors that contribute to onset and relapse, and the optimal treatments. I was drawn to the challenge of contributing to something that can have a meaningful impact on the quality of life of many people around the world.
What does a typical day look like for you?
I spend most of my day thinking critically and creatively. I read and write articles, analyse
data, and design new studies. This allows me to do deep dives into topics of interest, helping me to create new ideas and outputs to share with other people. Teamwork also forms a big part of what I do. Collaborating with others is crucial for producing innovative ideas that have real impact on people’s daily lives – the trope of a lonely scientist in a lab or stuck behind a computer screen is not always true!
What do you like to do in your spare time?
I’m all about crime, fiction and non-fiction, so I spend a lot of time reading, watching, and listening to it (but not doing it, obviously). My other hobbies are playing field hockey, baking, and camping. Having different ways to wind down and enjoy life outside of research is really important for increasing motivation and a positive outlook.
Follow Joanne on Twitter.