
By Alison Taylor, Demographer and Research Analyst, City Futures Research Centre

Recently released population estimates sank almost without trace. Yet careful scrutiny of the numbers can help explain not only current headlines, but also emerging political and policy issues.
The numbers confirm our begrudging acknowledgement of the end of the mining boom. They reflect our emerging awareness of a realignment in the states’ and territories’ power stakes resulting from relative job opportunities, costs of living and lifestyle options. And they underline the continuing challenges of predicting human behaviour.
As one year ends and another begins and we have time to reflect during our summer holidays, we often consider major changes. Should I move to Melbourne to study graphic design? Will you take the chance and try to find work overseas this year? Isn’t it about time to have that second child you’ve been planning? When will there ever be a better time to retire to the holiday house?
These decisions can be momentous for each of us, but will also impact on the fortunes of the states and territories. It is individual decisions, such as these, that lie behind the aggregate population estimates.
Numbers that are of real consequence. These numbers determine just how the GST cake is shared out by the Commonwealth government to each state and territory administration. Allocations that in turn, allow the states and territories to work out their budgets for the coming year.
Numbers that also describe the pressures being felt particularly in our main capital cities where the growth is concentrated. Pressures that fuel demand for homes, jobs and services. All of which are difficult and costly to provide.
So what can we learn from these recently released numbers?
Australia’s population growth peaked in 2008-09 when 442,000 people were added to the population over the preceding financial year. Last year in 2014-15, population growth eased for the second successive year with the addition of 317,000 people to the national population. This means population growth in Australia is currently running at about 28% less than at its peak just six years ago.
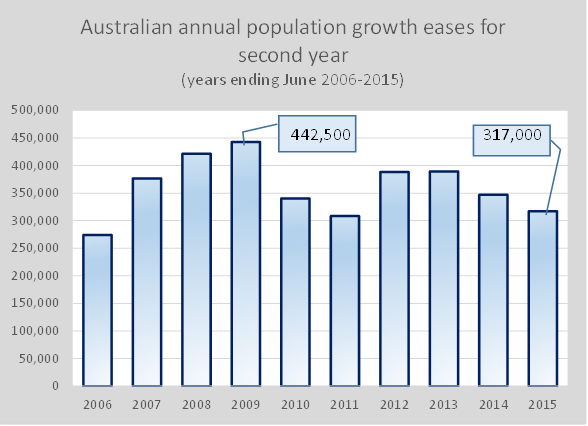
Source: ABS, Australian Demographic Statistics June Quarter 2015, Cat No 3101.0, released 17 Dec 2015
But how is each state performing? With size comes a greater share of that tax cake, yet with growth comes pressures.
Only three jurisdictions grew more than expected based on their share of the Australian population.
By assessing whether each state and territory grew more or less than their respective shares of the nation’s population, we can obtain one measure of performance.
Victoria was the stand-out performer, with 31.3% of Australia’s growth in 2014-15 yet only 25% of the population. New South Wales (NSW) and the ACT also accounted for a slightly larger share of national growth than their respective population shares. All other areas accounted for smaller shares.
Share of population at 2015 and share of growth 2014-15 (percentages)
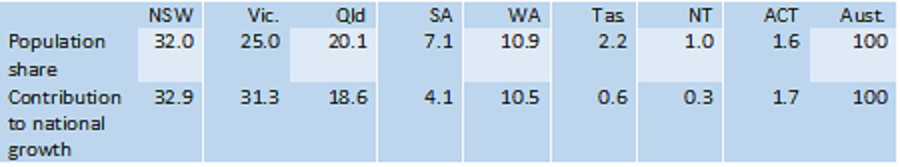
Source: Calculated from ABS, Australian Demographic Statistics June Quarter 2015, Cat No 3101.0, released 17 Dec 2015
End of the mining boom
Most of the population impact of the mining boom was felt in Western Australia (WA), Queensland and to a lesser extent, the Northern Territory. Some impacts occurred elsewhere given head office locations and related activity.
In recent years, WA’s share of national growth climbed dramatically to peak at 21.8% in 2011-12. Queensland saw population growth that represented 23.5% of Australia’s growth in 2011-12. Growth in both states has since slumped with WA only accounting for 10.5% and Queensland 18.6% of national growth in 2014-15.
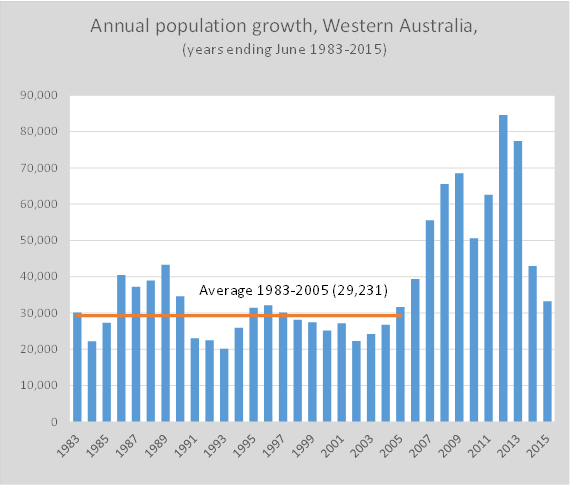
Source: ABS, Australian Demographic Statistics June Quarter 2015, Cat No 3101.0, released 17 Dec 2015
In 2011-12, population growth in WA peaked at 84,585 people. By 2014-15, growth had slipped to 33,200 people, just above the long term average prior to the boom (between 1983 and 2005) of 29,200 people each year.
Realignment of the growth generators
The majority of Australia’s population growth occurs in the three states with the largest existing populations; NSW, Victoria and Queensland. Over the past 30 years, the share of national growth in these three states alone has been as low as 70%, but averages closer to 80%.
In 2011-12 when growth was strong in WA, the big three accounted for just 70.8% of national growth. But by 2014-15, this share had jumped to 82.8% as growth in WA declined.
NSW and Victoria alone currently account for nearly two-thirds of Australia’s population growth, with Queensland growing slower than average.
Patterns of annual population growth vary considerably across the three states. Queensland’s recent growth has been impacted by reduced mining activity investment. This meant less demand for workers in the construction phase of new mines. In 2014-15, annual growth of nearly 59,000 was very similar to the longer term average prior to the mining-led boom that commenced in 2001-02 (average of 60,362 between 1983-2001).
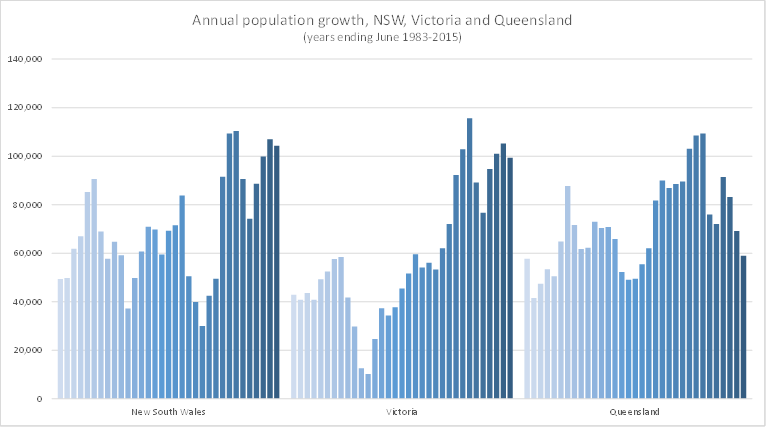
Source: ABS, Australian Demographic Statistics June Quarter 2015, Cat No 3101.0, released 17 Dec 2015
In contrast, both NSW and Victoria experienced recent growth substantially above historic levels. All three big states experienced a slowdown in growth following 2008-09 as the impact of the GFC was felt. Growth in all three states hit a trough in 2010-11, which was then followed by a recovery. In contrast to NSW and Victoria, Queensland’s growth then eased.
In both NSW and Victoria, growth continued albeit with minor slowdowns in 2014-15. These two states are currently driving Australia’s growth accounting for more than six out of every ten additions to Australia’s population in 2014-15.
Predicting human behaviour
Population growth results from two factors: natural increase when the numbers of births exceed the number of deaths and net migration gains when the numbers of people arriving exceed the number leaving. Of these, natural increase is the easiest to predict as patterns of fertility and mortality are relatively stable, reflecting long-term trends and population age structure.
In contrast, patterns of migration are much more volatile and can change rapidly. The reasons for people moving vary and are difficult to isolate to one driver alone. So while people moved to WA to get work in the mining industry, that move might also have been prompted by unemployment, relationship breakdown or the end of a rental lease.
Economic, social, environmental and even political factors can contribute to such decisions. Thus, it is impossible to suggest that levels of annual population growth can be attributed to single events. And difficult to accurately predict future levels of annual growth or people’s behaviour in any one year.
So will you be making a move this year?
No Comments so far ↓
There are no comments yet...Kick things off by filling out the form below.