
By Chris Pettit, City Futures Research Centre.
In an era of digitisation and smart cities we have seen the rise of city dashboards. These dashboards provide important information in the forms of graphs, charts and maps and hold the promise of better management and planning our cities. There is also an expectation that dashboards will provide greater accountability of government to communities through increased transparency in city performance. These hopes and expectations are evident in the plethora of dashboards launched to monitor the spread of COVID-19 and the response of governments to the pandemic.
The COVID-19 Australian Property Market Dashboard
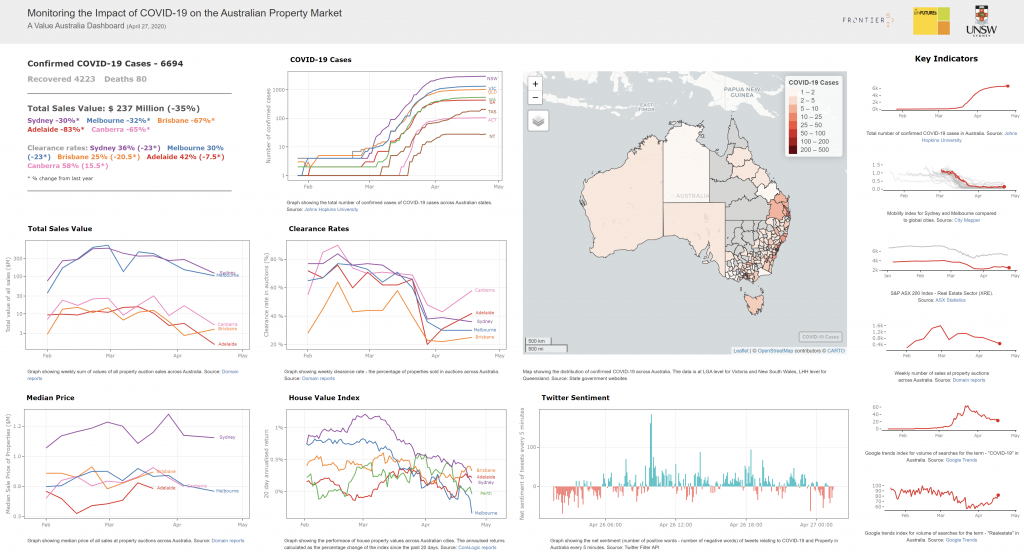
In response to the COVID pandemic, City Futures Research Centre has created a COVID-19 Australia Property Market Dashboard. The dashboard has been developed by Dr Balamurugan Soundararaj in the City Futures City Analytics team, as part of the Value Australia project – a CRC-Project in partnership with FrontierSI, Commonwealth Bank of Australia, PropertyNSW, Liverpool City Council and Omnilink. The COVID-19 Australian Property Market Dashboard provides a current snapshot of how the property market is performing before and during COVID-19.
The dashboard consists of an interactive map of Australia identifying hotspots of COVID-19 cases based on Department of Health data from state and territory governments from across Australia. It also provides a series of graphs and chart which report on a number of key property market metrics including: total sales value, median property prices, auction clearance rates, the house value index, performance of the ASX 200 real estate sector, the volume of property sales, market sentiment, city mobility and other key indicators. These data are presented alongside the COVID-19 cases reported for each state to assist government, industry and communities understand the current impacts COVID-19 is having on the Australian Property Market. The dashboard is real-time, interactive and updated daily-weekly, depending on the frequency of updates from the live data feeds.
As of 22 April 2020, the dashboard reports that the total volume of sales across Australia is down $237 million as compared to the same time as last year, with auction clearance rates dropping in all major cities across Eastern Australia except Canberra. It is hoped the insights obtained through the dashboard assist Australians to better understand, monitor and make more informed decisions in relation to property as the COVID-19 pandemic continues to unfold.
The COVID-19 Australian Property Market Dashboard is one of many dashboards launched to monitor the pandemic. One of the most notable is the Johns Hopkins University COVID-19 Dashboard, which provides a world view of recorded cases, deaths and recoveries.
A brief history of city dashboards
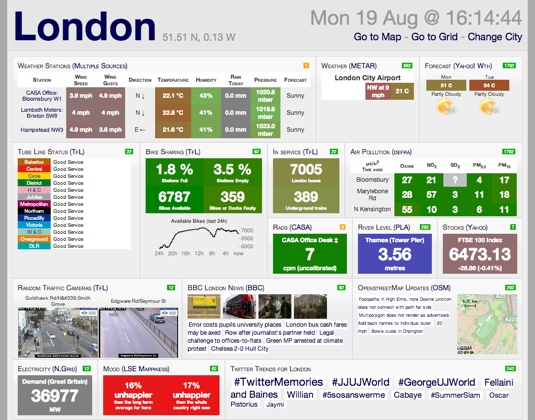
The COVID-19 dashboards come in the wake of the open data movement, which over the past decade or so has seen many government agencies establishing online open data stores, portals and feeds. This vast array of open data provides the fuel for public facing dashboards, made possible through technological solutions such application programming interfaces (API). One of the most notable early city dashboards is the City Dashboard of London, developed by University College London’s (UCL) Centre for Advanced Spatial Analysis. The London Dashboard provides a number of real-time data feeds for the City of London including CCTV traffic feeds, performance of the London Tube, Air quality, Twitter trends, and more.
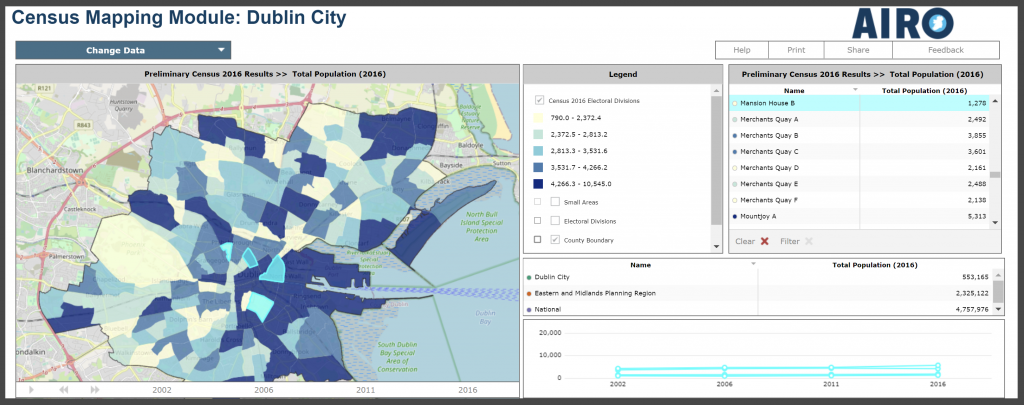
Another notable example of a city dashboard effort which capitalises on the open data movement is the DublinDashboard led by the Programmable City Group at Maynooth University (Kitchin et al. 2016). The DublinDashboard in fact comprises a suite of city dashboards focused on a range of city themes including housing, transport, housing, and demographics. Whilst some of this data is up to date and real-time, many of these dashboards comprise static data based on census data with snapshots in time presented across 5-year periods.
City Dashboards: an Australian perspective
In 2010 the Federal Government established the Australian Urban Research Infrastructure Network (AURIN) which has continued to collate urban datasets – 5,000 at last count – from various sources into an online workbench open for University and Government purposes. Such data combined with other urban data have been used by the Federal Government to formulate its National Cities Performance Framework Dashboard, which comprises 22 city dashboards from across the country.
The challenge is to keep these data current, as most are based on manual surveys which are updated five yearly and annually at best. But there is a wealth of performance assessment data in these dashboards.
No Comments so far ↓
There are no comments yet...Kick things off by filling out the form below.