City Futures Blog

News and research in housing and urban policy, from Australia’s leading urban policy research centre.

City Futures Blog random header image

The working holiday survives hard times

Posted by on May 16th, 2016 · Demographics, Migration, Transport

5584216287_8ac43009c2_z

By Alison Taylor, Demographer and Research Analyst, City Futures Research Centre

‘The world is a book, and those who do not travel read only a page’ – St Augustine

As our winter and the northern hemisphere summer holidays approach, Australians’ love of travel comes to the fore – I’m packing my bag right now! For some it’s a short holiday; but others combine travelling with work to extend their stay. I wonder how the working holiday has been impacted by the GFC?

Many people continue to travel to Australia – some stay so long they actually get counted as part of Australia’s population. (To be counted, they must stay for 12 months out of a 16 month period.)

In 2013-14, about 50,000 people entered Australia on a visitor visa but stayed for at least 12 months. In that same year, around 16,000 people on visitor visas left after an extended stay. This resulted in the addition of 33,000 longer term visitors to Australia’s population, up over 50% from a decade earlier.

workhol

Similarly, the number of people on working holiday visas has increased dramatically over the last decade. The net addition to Australia’s population in 2013-14 (27,360 people) was up almost three-fold on numbers from 10 years ago (9,400).

There was a GFC-related dip in 2009-10, after which arrivals peaked in 2012-13. For the first time in the past four years, arrivals eased in 2013-14.

More people generally arrive on working holiday visas, than depart. However in 2013-14, this ratio was at its lowest with just two arrivals for every departure. Does this reflect Australia’s declining attractiveness? Are there fewer jobs available since mining employment eased? Are recent currency movements having an impact?

And what of Aussies travelling overseas? Not just for a quick holiday but a longer-term stay. Over the past decade, more Australians have departed permanently for overseas than those who returned to Australia. At the beginning of the decade, a total of around 20,000 people each year were lost. As the GFC hit, the number of Australians returning home increased while the number departing eased, resulting in a very small net loss of less than 2,500 people in 2008-09.

In 2013-14, the number of Australians returning was at its lowest level since 2005-06, while the number departing permanently was at a decade-long high. As a result, the population loss in 2013-14 was back to pre-GFC levels of around 20,000 people. Are Australians finding better options overseas and not returning after their working holidays? Are the jobs available in the global marketplace providing better returns than those on offer in Australia?

arrivedepart

Perhaps the ease of international travel has contributed to more long-term overseas postings. A quick trip home a couple of times each year can ease the separation from family and friends.

I can’t help thinking that this is an overlooked opportunity in our quest for new industries and innovative responses to the post-mining dominated economy. We need to attract our diaspora back to contribute to the development and functioning of our cities; to bring their insights, assets and experience. Australia needs to enhance its global connectivity and this is one obvious way.

“No one realizes how beautiful it is to travel until he comes home and rests his head on his old, familiar pillow.” – Lin Yutang

Well I’ve got to run for my plane now. I’m off to read some more pages in my book of world travel. But I’ll be looking forward to returning to my very own pillow.

The Australian housing market is a house of cards

Posted by on May 6th, 2016 · Affordability, Government, Housing

Screen-Shot-2016-02-23-at-2.44.33-PM-copy

When Prime Minister Malcolm Turnbull announced that his government would change nothing about Australia’s tax settings on negative gearing and capital gains, one of the Sunday papers ran the headline ‘Safe as Houses‘. Hardly. The Australian housing market is a house of cards – and that’s the view of the property lobby itself, as depicted in the Property Council of Australia’s media campaign against reform of negative gearing.

This is an extraordinary admission as to the basic unsoundness of our housing market. (Similarly honest admissions have come recently from Mortgage Choice CEO John Flavell, who describes the housing market as ‘a very finely balanced and actually pressured system at the moment‘ – which is pretty much the scientific definition of a bubble.) After all, houses of cards collapse, and bubbles burst – and they do so without anyone doing anything deliberate to make it happen. The Government’s and the PCA’s position of ‘JUST. DON’T. TOUCH. IT. DON’T. GO. ANYWHERE. NEAR. IT.’ will not save a house of cards.

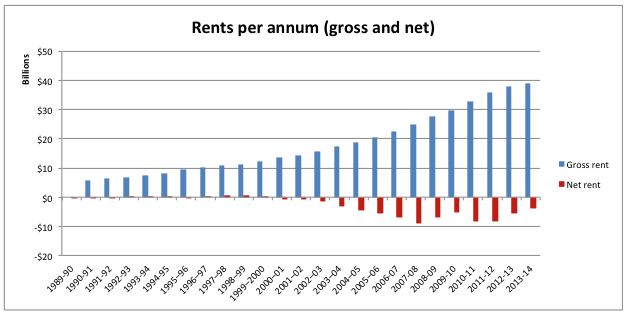
Leaving aside the metaphors, let’s look at some numbers from the Australian Tax Office on negative gearing and rental properties and see how they stack up. First, the total rental income declared by Australian landlords each year, both gross and net of expenses such as interest and depreciation. As you can see, the Australian rental property sector is now a $40 billion per year industry that has run at a net loss since the turn of the century.


Screen Shot 2016-05-04 at 10.25.55 PM


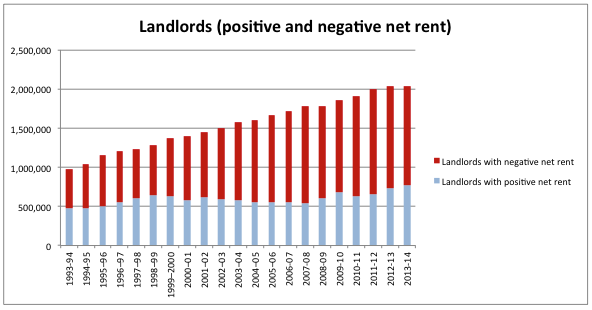
But the number of landlords has grown substantially (by almost 700 000 over the same period). Most of them (63 per cent) are operating at a loss.


Screen Shot 2016-05-04 at 10.29.46 PM


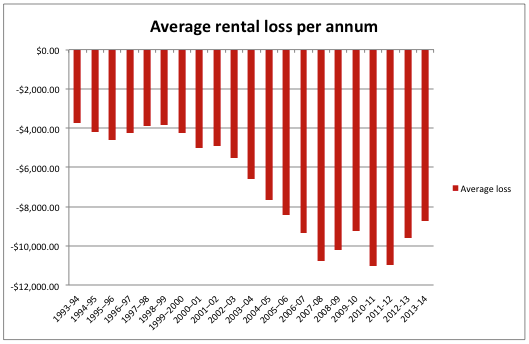
A loss, on average, of almost $9 000 in the most recent year.


Screen Shot 2016-05-04 at 10.30.43 PM
Losing $9 000 a year is not ‘saving’ or, as the Government likes to call it, ‘getting ahead‘. It is only getting ahead if someone comes along later and buys the property from the landlord for more than what they’ve lost.
Now, our tax settings cushion those losses by allowing them to reduce the landlord’s tax liability on their non-rental income – but they’re still losses. And if someone comes along and pays more, our tax settings tax the gains at only half the rate of non-rental income – but that’s still ‘if’ someone pays more. This way of ‘getting ahead’ is a gamble – a gamble on some future person borrowing and spending in an even bigger way than the present landlord has.
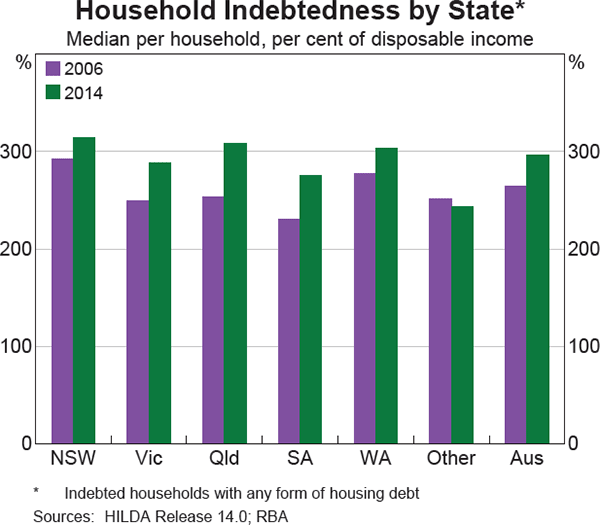
And there’s no promise that anyone will pay more, and the prospect of it happening recedes as the costs of servicing huge debts consume too much of people’s incomes, and too many people cannot credibly promise to pay such debts off.
graph-2.6
(Source: RBA Financial Stability Report, April 2016)
And as the prospect of finding someone to pay more recedes, we should expect more landlords to look to cut their losses, bring their properties to the market, and bring on the fall in prices – the collapse of the house of cards.
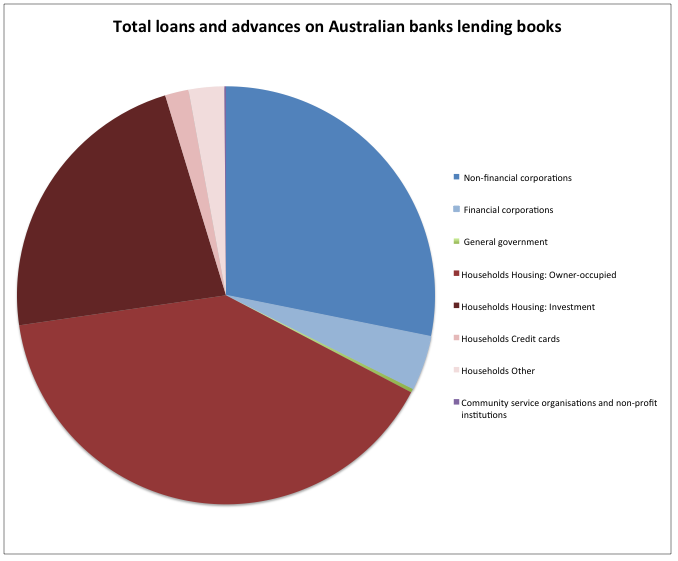
Of course, it is not only landlords who are affected. As more people have gambled on property as landlords, they’ve bid up the prices and the amounts borrowed by owner-occupiers – whether to buy houses for their own shelter, or to speculate in their own housing, or some degree of both. And as landlords have gambled with borrowed money, so have the banks gambled too, and become hugely exposed to the housing market. Loans to landlords – or, viewed the other way, landlords’ promises to pay back with interest – are a major asset of Australian banks. Of the $2.3 trillion of loans on their books, loans to landlords comprise about 23 per cent of all loans by value, and adding loans to owner-occupiers brings total loans for housing to about 63 per cent.
Screen Shot 2016-05-06 at 9.42.02 AM
(Source: APRA Monthly Banking Statistics, March 2016)
As prices fall, those promises to pay back with interest become less credible, and the backing they give the banks’ own creditworthiness is diminished. As the Murray Review last year concluded, our tax settings around negative gearing and capital gains tax have made ‘housing… a potential source of systemic risk for the financial system and the economy’.
Frightening stuff – but instead of being paralysed by it, or willfully blind to it, as the Government appears to be, we should be exercising our minds as to how we could have gotten to the present point, and setting our tax policies so that in future people are not induced to take on such huge debts, and waste so much of their creditworthiness on gambling, and instead use it to develop the means for producing more and better goods and services that increase real prosperity.
And when the present house of cards falls – with or without tax reform – and bank money contracts, we’ll need the Government to use its fiscal power to maintain incomes and employment, and to do justice with respect to all the liabilities that are left standing. The matter of doing justice after a collapse is something that no party has yet addressed.

The Political Economy of the Compact City: the Story from Perth

Posted by on April 27th, 2016 · Cities, Government, Housing supply, Planning reform, Transport

Perth CBD from Mill Point [By JJ Harrison (jjharrison89@facebook.com), CC BY-SA 3.0 (http://creativecommons.org/licenses/by-sa/3.0), via Wikimedia Commons]

After enjoying great economic prosperity during the mining boom, Perth now finds itself grappling with the challenges of pursuing a compact city agenda in a more financially precarious era.  The effects of this new era are already emerging; for example, while the high-profile Elizabeth Quay waterfront redevelopment opened recently, some of its associated private development projects have encountered delays. As Sydney and other major Australian cities will attest, overcoming such economic challenges to successfully pursue a compact city agenda is no easy task.

Yet Perth does have a distinct advantage over most Australian cities in this respect, thanks to its long-standing centralised planning model. The details of this distinctive planning culture are examined in a new City Futures Working Paper by Dr Raymond Bunker and Dr Laurence Troy. Entitled The changing political economy of the compact city and higher density urban renewal in Perth, the paper offers a detailed examination of the policies and politics shaping redevelopment efforts in Perth in the 21st century. It is the second such working paper to provide a long-term perspective on Australian compact city policy, following the paper on Sydney published in November 2015.

The history of urban renewal in Perth exhibits both familiar and unusual qualities. On the one hand, Perth’s planning efforts have benefited from the continuity of being driven by a centralised planning authority since the 1960s. In keeping with the growing complexity of metropolitan planning tasks, this authority has expanded its role over the years, and has received substantial bipartisan support. This has allowed it to avoid some of the dislocation experienced in other states caused by the government’s appropriation of metropolitan strategies as political statements.

On the other hand, Dr Bunker and Dr Troy argue that the same key elements of neoliberal urban governance have informed compact city policy in Perth as in other Australian cities, namely “a shift in focus from use value to exchange value in renewal projects, enhancements to the executive power of state governments, and greater interaction by governments with powerful lobbying groups and corporations.” To allow a comparison with Sydney, the paper adopts the same structure for examining the key factors that contribute to and demonstrate these outcomes, including:

  • the changing focus of Perth’s metropolitan strategies, from 2004 to 2015;
  • recent directions in infrastructure policy and funding;
  • the emergence of public development corporations; and
  • the use and reform of the planning system.

Through this analysis, the paper concludes that:

“[Perth’s] isolation and relatively small and cohesive bureaucracy has allowed it to address the challenges associated with the transition towards a more compact city in ways that reflect [a] distinctive (if not unique) planning culture…[this means] an adequate system of ‘monitor and manage’ in relation to short, medium and long-term aspirations is being put in place.”

This working paper has been produced as part of an ARC Discovery Project entitled Planning in a Market Economy: The Case of the Compact City, being undertaken by Bill Randolph, Simon Pinnegar, Hazel Easthope, Laurence Troy and Laura Crommelin. Together with the Sydney piece, these policy papers lay the groundwork for the project’s innovative conceptual and methodological analysis of the nature and extent of higher density urban renewal in these two cities. This analysis will include mapping of recent high density developments against housing targets and projections; an examination of the full life-cycle of high density developments in key case study areas, from planning to development to sale; and a qualitative exploration of the motivations and experiences of those involved in creating the current policy context. The project is due for completion in late 2016; check back regularly for further updates.

Resilience through healthy planning

Posted by on April 14th, 2016 · Wellbeing

17128721219_3925de06d0_z

By Susan Thomson, Professor of Planning and Associate Director, City Futures Research Centre, and Peter McCue, Executive Officer NSW Premier’s Council for Active Living. This is an edited version of an article previously published in March 2016 in a special issue on resilience of ‘New Planner’, the journal of the Planning Institute of Australia, NSW Division.

Towards the close of 2015 world leaders met in Paris and agreed upon a global position for climate change acknowledgment and action. It is now incumbent upon us, particularly professionals such as planners, to embrace this hopeful vision and make it happen. Healthy planning has a key role to play in supporting the evolution of a resilient city with an equally resilient and resourceful population, supported by technically skilled, ethical and informed professionals.

In thinking about resilience, we propose a Model that forges the personal and the professional in the context of healthy planning. We start with a broad conceptualisation of resilience and then unpack our ideas for you to consider.


Defining resilience

While there are many different definitions of resilience upon which we can draw, they generally incorporate two broad themes. First, is the notion of environmental readiness for shifting weather patterns and their accompanying impacts such as sea level rise, floods and wild fire. Second, are people’s physical and psychological abilities to bounce back and recover from adversity and in some cases, transform in new and positive ways. ‘Resilience is the capacity of individuals, communities and systems to survive, adapt, and grow in the face of stress and shocks, and even transform when conditions require it.’(1) Adaptation occurs at the local level where social capital, community cohesiveness and individual responsibility are best able to be supported.(2) This speaks to social equity and fairness in a newly constituted localised caring and nurturing urban community, as noted by internationally renowned Australian urbanist Brendan Gleeson.(3)

These conceptualisations reflect a comprehensive understanding of resilience. This is at the heart of our Model which links resilience with readiness to deal with whatever comes, as well as preventive action and attention to equity. These concepts are central to healthy planning.


The Healthy Planning Model of Resilience

resiliencemodel


Our Model comprises three segments.

Personal Practices: This is about individual attitudes to wellbeing and actions to support our own health so that we can rise to the challenges presented by adversity. We well know that regular physical activity, a nutritious natural diet, and time for socialisation, relaxation and fun are foundations for good physical and mental health. We espouse this for the community – but do we take the message seriously ourselves? How much do we consider our own health as an underpinning for resilience-readiness as community leaders and morally responsible professionals? Are we prepared to build connections with others in the places where we live and work and lead by example? Is this part of a personal ethic of care that we should nurture in ourselves and those around us as together we face unprecedented challenges and unpredictable changes to our way of life? Our response cannot be quarantined to the professional segment of our lives – resilience is required at all levels.

Professional Practices: This part of the Model focuses on the way we work as planning professionals, particularly employing the practices central to healthy planning:

  • The use of an interdisciplinary framework – linking planning knowledge with economics and health; and working alongside environmentalists, community advocates, artists, local residents and the like.
  • Partnership building across all sectors of government, industry and the not-for-profits – for example, ensuring that the provision of new physical infrastructure is accompanied by behaviour change programs to facilitate desired actions.
  • The application of co-benefits – recognising that one policy can have multiple benefits, making it economically sustainable, as well as effective in gaining environmental, health and social benefits.
  • The ways in which evidence is used to effectively guide policy development to underpin implementation on the ground.

In addition to these now accepted ways-of-working, planning professionals have a responsibility to question current practices, asking if they are resilient-ready. Moving away from the central provision of energy, food and water towards more distributed and localised sourcing is indicative of where this is already happening. The sharing economy is another example. But such practices inevitably challenge traditional orthodoxies, unsettle powerful elites and do not always operate smoothly and without unintended consequences (Airbnb for example – when rowdy holiday makers disturb local residents). Nevertheless, it is mandatory for the contemporary professional to engage with creative and innovative ideas – no less for planners engaged in resilience work. And it’s not only about being philanthropic. Professional resilience is about recognising opportunity emerging from change – developing a suite of skills that are transferable to other jobs and activities, rendering the planner a resilient professional in a turbulent employment environment.

The third and final segment of the Model is the Application of Healthy Planning. This is where healthy planning is applied with resilience in mind. It does not require new thinking or extra effort. Rather, it is a slight readjustment of context and an appreciation that the central tenets of healthy planning are environmentally sustainable and supportive of resilience. Access to, and use of a well-connected active transport network for everyone in the community is essential – car dependence is not healthy, sustainable, nor resilient, especially when petrol supplies have been destroyed or must be heavily rationed. The provision of food security via community gardens, urban orchards and school kitchen gardens could well be the only immediate source of nutrition post disaster. The development of socially inclusive and connected communities, a key healthy planning principle, will help neighbours face adversity and support each other in its wake. This is an important aspect of mental health helping to build resilience to environmental challenges.(4)

P1010021small

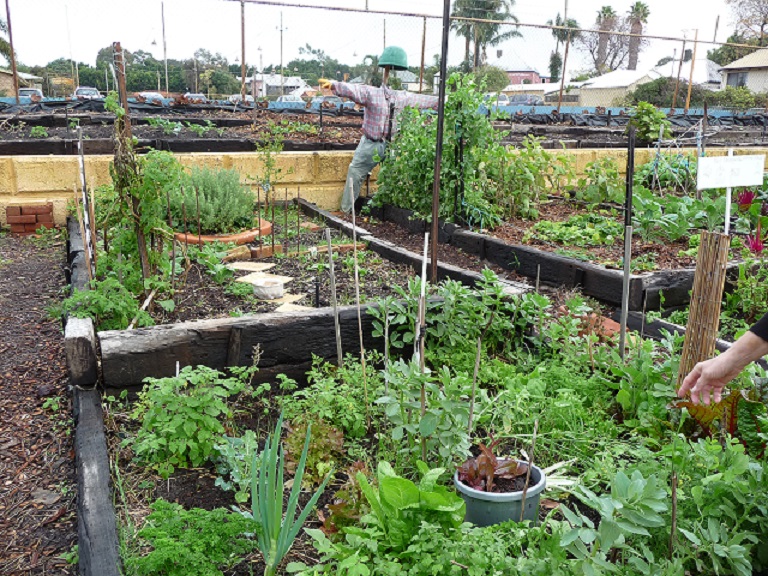
Community gardens build resilience, sustainability and good health in different ways – providing fresh food across a neighbourhood, reducing food miles, bringing people together and ensuring good health through physical activity, relaxation and a connection with nature.


Conclusion

Developing the resilience of our planet, its dependent natural systems and its people is critical in the face of unprecedented global environmental challenges. Planners play a central role in this huge task. We offer our Healthy Planning Model of Resilience as a way to bring personal understandings and insights into alignment with professional expertise and skills, in the context of applying healthy planning principles. Healthy planning is increasingly acknowledged as core to good planning – it can also underpin resilience at the local level. Planning’s ability to support health and resilience-readiness is a very positive aspect of the discipline. Yet another example of the relevance of planning in creating a sustainable, healthy and resilient future for our planet and the life that is dependent upon it.


References

  1. Smart Growth America. Building Resilient States: A framework for agencies, 2015, org/resilience
  2. Keim, ME. ‘Building Human Resilience: The role of public health preparedness and response as an adaptation to climate change’, Am J Prev Med, 2008; 35(5).
  3. Gleeson, B. 2010, Lifeboat Cities, UNSW Press, Sydney.
  4. Curtis, S. 2010, Space, Place and Mental Health, Ashgate, England.


High housing costs create worries for city tourism and hospitality

Posted by on April 7th, 2016 · Affordability, Transport

11130781276_b583931d87_z

By Ryan van den Nouwelant and Laura Crommelin

Watch any tourism or branding campaign for an Australian city, and chances are you’ll see plenty of appealing imagery of amenities in and around the CBD – be it restaurants, nightclubs, parks or galleries. It is a common mantra in urban planning that good “amenity” is valuable to the economy both in its own right, particularly to attract tourism, and for attracting a productive workforce that boosts the economy more generally.

But in a recent research project, we found that hospitality businesses – including restaurants, bars and hotels – are facing some headwinds in our CBDs. These stem from what economists call a thin labour market. This roughly boils down to businesses struggling to find good workers.

In a series of interviews in Sydney, we found instances of employers experiencing problems with recruitment, reliability and retention of lower-paid workers in particular. These all have the potential to undermine the viability of the CBD hospitality sector.

Why hospitality is vulnerable

From our analysis of census data, the CBD hospitality sector is typically the biggest employer of lower-paid CBD workers – it represents around one-in-five such workers. And it is the CBD sector most dependent on lower-paid workers. Around two-thirds of hospitality workers in the CBD are in the lower pay range.

Census and housing market analysis revealed these lower-paid workers are making a lot more housing compromises to work in the CBD, compared with lower-paid workers elsewhere in the broader metro area. This includes: being more likely to rent; more likely to share with unrelated adults; more likely to forgo extra space (spare rooms or backyards); and more likely to face a longer commute. All else being equal, these compromises are going to discourage the lower-paid workers from working in the CBD.

Interviews suggested other CBD industries don’t seem to be as affected. This is partly because many of the lower-paid workers in those industries are in entry-level positions. They are making these compromises for future career and income prospects.

Most industries that employ large numbers of lower-paid workers – like retail or manufacturing – also tend to be more distributed across the metro area, closer to where workers live. This doesn’t help CBD hospitality, though. It’s tethered to the galleries and convention centres in the CBD that attract the visitors.

To be sure, these problems were not a universal experience among hospitality businesses. There were often other mitigating factors, which ensured they could attract good workers.

CBDs are usually the hub for public transport systems, which helps overcome much of the additional distance people travel. And, somewhat ironically, many lower-paid workers like working in the CBD because it offers such good amenities and lifestyle.

In some instances, hospitality jobs also seemed to be a good fit with available sources of lower-paid workers. Seasonal jobs and evening jobs attracted international workers and university students, who brought skills and experience that hospitality jobs might not usually attract.

Heed the warning signs

The sky is not falling in. However, businesses and industry groups we spoke with were increasingly aware of the challenging housing circumstances many of their workers faced.

It’s important to recognise that high housing costs aren’t just making life difficult for lower-income households, but can have broader economic impacts too. There is also a concern that this represents a thin end of the wedge – as housing affordability around the CBD deteriorates further, there’s every possibility it will leave other CBD industries seeing their lower-income labour market thinning out.

We also found governments are not well positioned to respond to this issue, which crosses a number of policy “silos”. So housing agencies hope planning agencies will distribute jobs to where the workers live; planning agencies hope transport agencies will connect distant labour markets to the CBD jobs; and transport agencies hope housing agencies will deliver more housing where the jobs are.

In the meantime, our market-led housing strategies leave lower-paid workers struggling with longer commutes and poorer living circumstances, and CBD businesses at risk of thinning labour markets.


This article originally appeared on The Conversation. View the original article.

The tax reform right under Turnbull’s nose

Posted by on April 5th, 2016 · Affordability, Government, Transport

13383622853_81b07df83e_z

Three days was all it took for ‘the most fundamental reform to the Federation in generations‘ – Prime Minister Malcolm Turnbull’s proposal to allow each of the States to set its own income tax, at different rates, on top of the Federal income tax – to be consigned by State and Territory leaders to history (‘that proposal is not there. It is withdrawn. It is not acceptable to COAG‘). Midges live longer than that. Blog writers had barely enough time to start thinking of questions about the proposal (how would negative gearing work – would rental losses in Queensland be deductible against wages earned in New South Wales? If the both State and Federal income taxes were levied through the Australian Tax Office, would that offend the qualification at section 51(ii) of the Constitution?) when the whole thing was knocked off.

The Turnbull Government is once again without a tax reform agenda; instead, the Prime Minister is now working on media messaging about how ‘we have to live within our means‘.

Which is another misstep. ‘Living within our means’ is a principle familiar to households, whose spending depends on first getting money from somewhere – from selling labour, selling property or selling promises to pay it back with interest. Households’ abilities in all these regards – their ‘means’ – are finite, and so constrain their spending on life’s essentials and niceties; these constraints also induce households to save some money in anticipation of times when the getting of it may be harder. This way of thinking and acting makes sense for individual households, and firms too; it also makes sense for State Governments – though their ability to get money by levying taxes is an important additional ‘means’ that private sector entities don’t have.

But it doesn’t make sense to wish all entities in the economy would behave this way altogether (because as each saves, so they spend less, and reduce the getting of money by all: the paradox of thrift), and it doesn’t make sense for the Federal Government to think and act as if it is constrained like a household. The Federal Government doesn’t need to get money from somewhere else before it spends; in the Australian economy, it issues the national currency that underpins the payments system, and the notes and coins, through which all those other entities transact as they get and spend money. As such it can do things that households and other entities cannot – like spend without first getting money elsewhere – and it should operate according to different principles, like: ‘we have to maintain demand sufficient to engage all the labour that households are selling’, ‘we have to develop capital in our economy that makes labour as productive as can be’, and ‘we have to ensure that those who cannot work have incomes to buy a fair share of the products of labour.’

Thinking this way about the Federal Government entails thinking differently about tax. In particular, it means that the basic purpose of Federal Government taxation is not getting money for spending; instead, it is to ensure that all the other entities in the economy will use the national currency, and that some fiscal space is cleared for government spending without undue inflation. And rather than getting hung up on the absolute amount of taxation and whether it matches the amount of government spending, we should give more thought to questions of how taxation affects the shares of income and wealth that households end up with, and how it affects the economic choices and behaviour of individuals.

It is the equity and behaviour impacts of taxation that deserve greater attention in the current debate (and to the extent that the State income tax proposal would have obscured these aspects of taxation behind the State Governments’ household logic of ‘getting money to spend’, it is a good thing that the proposal was dispatched). And if the Prime Minister paid greater attention to these considerations, he might grasp hold of the really beneficial tax reform agenda that has recently been gaining ground in the public debate.

This agenda is land tax: a broad-based land tax, including on land used for owner-occupied housing and primary industry, levied at progressive rates according to per square metre land values. It ticks every equity and behaviour box:

  • land is in fixed supply so cannot be taxed out of existence;
  • land cannot be moved out of the jurisdiction so the tax is impossible to avoid (unpaid land tax mounts as a charge against the registered title);
  • land ownership promises gains (rents, price increases) that come not from any effort by the owner, but from the uses to which other persons could put the land, so taxing land values gets at unearned gains;
  • land tax, payable year in and year out, is a spur to owners to put their land to productive use, or sell it to someone else who will, so it taxes land out of speculative or unproductive holding and into the market, thereby improving affordability.

The States currently levy land tax – on a narrow base and with inadequate thresholds and rates – but there’s no reason why the Federal Government couldn’t do it (in fact, for the first half century of the Federation, it did).

Use it as an opportunity to remove other taxes that are inequitable or that badly affect individual decisions (like payroll tax, stamp duty for owner-occupiers (let’s keep stamp duty for landlords) or even income tax), add some transitional measures (for example, let the amount of stamp duty paid by an owner – whether that was $20 000 last year, or £20 fifty years ago – stand as a credit against their land tax liability) and enshrine some hardship provisions (for example, let any owner-occupier without the means to pay land tax other than by sale of their home defer the liability, so that it mounts as a charge against the property), and there’s your tax reform for greater housing affordability, productivity and equity.

More and more people are coming around to land tax reform. It was a key recommendation of the Henry Review; more recently, the McKell Institute has published a report in support of land tax/stamp duty reform, and today, the NSW Business Chamber, the NSW Council of Social Service and the NSW branch of the Australian Manufacturing Workers Union have jointly made a case for land tax/stamp duty reform. Each of these parties has framed their support for land tax reform as a matter of State Government finances, and so emphasises its role as a source of revenue (to get and spend money), and each puts forward different transitional and hardship measures, but the case on economic behaviour and equity grounds is also made.

And while the Prime Minister has cast about for a tax reform agenda, the Government’s own Minister for Major Projects, Paul Fletcher, has been talking up ‘value capture’ – a variation on the theme of land tax, by which the Government proposes to take, in the form of money, some of the increase in the value of land that comes from its being serviced by new transport infrastructure. The value capture discussion has a way to go, and we might question some of the directions that it is presently taking: in particular, the Minister frames value capture as a means of financing government spending; however, as the foregoing discussion suggests, the Federal Government shouldn’t feel that its spending for public purposes is constrained by the amount of value it may capture, nor that it needs private interests to drive infrastructure spending decisions. The Minister also indicates that the Federal Government is interested in value capture mechanisms that apply narrowly to designated areas that will benefit from infrastructure development; however, rather that relying on government officers to be able to identify and designate at the outset which are the areas that benefit, why not take a wider approach, and let the market show where the benefits are realised, and tax them wherever that is.

Here is the germ of a tax reform agenda, right under the Prime Minister’s nose.

Housing Shortage? Empty houses, housing affordability and artificial scarcity

Posted by on March 29th, 2016 · Housing supply

Below is an extended version of an article published in the Sydney Morning Herald on Monday 28th March 2016.


By Laurence Troy and Bill Randolph

A major myth that permeates the recent debate on housing affordability is that the present level of housing supply is not meeting demand. Scarcity of housing, we are repeatedly told, is driving up prices. The answer lies not in tampering with the housing finance and taxation system, but simply to generate more supply. Indeed, negative gearing and capital gains concessions act to encourage investment in housing, driving increases in supply.

Instead, the culprit lies elsewhere – in every Town Hall across the country. The principle cause of the housing supply problem is the land use planning system, which inhibits the effective release of land for new supply. Reduce the barriers caused by planners and housing supply will respond, bringing affordability back into the market.

Of course, more reasoned voices can be heard above the clamour, focusing on the perverse effects of our highly skewed housing taxation and subsidy system as well as a complete lack of a national housing policy framework to support new affordable housing supply. Nevertheless, throughout this debate there is little recognition of the broader shifts in housing stock, tenure and opportunity that these policies have created and the impacts on the housing supply issue they help to create.

What follows are a couple of major points that illustrates that there are serious limitations in current debates. The first is that when we talk about supply, a large portion of the existing housing stock which is standing empty is completely ignored. The table below shows the number of dwellings at the last census that were unoccupied, together with the number of dwellings that were being used for non-residential purposes such as short stay accommodation.

Unoccupied Dwellings

Other Tenures (including Visitor only)

Occupied Dwellings

Greater Sydney

118,499

114,920

1,479,871

Greater Melbourne

141,289

98,614

1,390,954

Greater Brisbane

57,823

44,801

712,201

Source: ABS 2011

The data highlight that there are very large volumes of unoccupied, or at best underutilised, dwellings in all our major cities. At the last census there were nearly 120,000 empty dwelling in Sydney alone, representing nearly one fifth of the projected new housing demand to be met by 2031, or equivalent to nearly 5 years of projected dwelling need. If you chose to accept that there is a housing supply problem in Sydney at the moment, then these figures strongly suggest that this is an artificially produced scarcity as the number of empty dwellings could more than account for the notional supply shortfalls.

When this is combined with dwellings not being used for permanent a residential purpose, that is they were being let out as short term accommodation and so on, the total number of dwellings reaches 230,000 in Sydney, and 238,000 in Melbourne. The sheer scale of these numbers cannot be the result of sampling error or short periods of vacancy at census time.

There is of course a possibility that these aggregate figures could be accounted for by a spatial mismatch between supply and demand – that they are in places that people simply don’t want to live. But this turns out not to be the case. When these numbers are mapped there is a clear concentration of unoccupied dwellings in central parts of all our metropolitan areas. As an example, the following map shows concentrations of unoccupied dwellings by SA2 in Sydney from the 2011 Census. It shows a clear bias towards inner, eastern suburb and north shore locations. This aligns with established areas of highest rents and prices. This picture is repeated in the other cities. Why, then, are these home left vacant when they could command the highest prices or rents?

The second major point is that the underlying investment structure of the housing market is driving a mismatch between the existing supply of housing and housing need. The next map shows the rental yields for residential property by SA2 across Sydney in 2011. What it reveals is that rental yields tend to be highest in the outer suburbs where residential property is cheaper to purchase. Where rental yields are lowest is in the inner city and eastern and north shore suburbs where capital values (and therefore gains) are highest. And this is where we also see higher rates of vacant properties. This is not a coincidence.

This observation reflects the dominant driver of negative gearing together with capital gains tax concessions in which capital gain is the main objective, not the rental yield that you would expect from a positively geared property. Unsurprisingly, on the fringe where there can be less expectation of capital gains, there are much lower rates of empty dwellings.

Together these maps highlight some of the perverse outcomes that current tax and housing policy settings are driving in Australian cities. This only further exacerbates the emerging spatial inequalities experienced in our major cities, helping drive unaffordability in central, well connected and serviced parts of the city and an overall supply crisis driven not by the planning system, but by a concentration of empty and underutilised housing.

Furthermore, much of the new higher density residential market in Sydney is being built for investor owners in precisely the locations where there appears to be a concentration of homes standing empty. Of course, there are clearly reasons why some homes are vacant for short periods of time and it is entirely possible that the period since 2011 has seen some of the homes enumerated then brought into use. But there is little reason to believe that, overall, the picture has changed dramatically.

If anything, this trend is likely to have worsened. Housing supply is being increasingly driven by a property investment market which is failing community expectations of affordable homes in places people might want to, let alone need to, live. It’s this part of the market that is likely to be to blame for largest numbers of empty homes – given that losses against a rental investment can be offset by negative gearing and resulting capital gains taxed at a much reduced rate when the property is eventually sold. Leaving housing empty is both profitable and subsidised by government. This is both taxation lunacy and a national scandal.

Moreover, the failure of governments to acknowledge the pervasive prevalence of empty homes only adds to the on-going affordability crisis. Other countries take a much less sanguine approach to owners deliberately leaving properties vacant when there is a clear housing shortage, often by imposing significantly higher rates or property taxes on housing known to be empty for long periods.

It’s high time the NSW State government looked at ways in which reluctant property owners were encouraged to bring property deliberately left vacant onto the market. We have plenty of data that can easily identify properties that appear to be vacant – just ask Sydney Water or look at the electoral roll. Until such time as we act decisively on this issue, arguments about the need for less planning to support increased housing supply will continue to ring hollow.

Let’s start to address both the housing supply and the housing affordability problems by solving the empty homes problem first.

Where is housing “affordable” in Sydney?

Posted by on March 24th, 2016 · Affordability

By Ryan van den Nouwelant, Hal Pawson and Laurence Troy

The affordability of housing in a particular neighbourhood is a tricky thing to reduce to a single metric. One option is to try and account for the complexity of dwelling composition and quality over space and time through data-intensive indices. But, more often, there is a tendency to reduce all housing market activity to the prices at the median. This is a limiting approach.

The median is only one point on the housing spectrum (the midpoint, to be precise!). It can be a reasonable indicator of activity elsewhere on the spectrum. But it is possible and preferable to directly examine these other points instead. Rather than asking simply whether the median dwelling is ‘affordable’ in a given place, it is possible to look at what proportion of dwellings is affordable. This is the approach we explore here.

Our starting point is a gross household income of $100,000pa in 2015. This is taken as a reasonable approximation for the midpoint of incomes for aspiring home owners in Sydney, and so is higher than the midpoint of all households by income.[1] For this income level, we can calculate the purchase price that could be afforded, based on certain assumptions.[2] This gives us an ‘affordable’ threshold purchase price of $513,180.

So far, this is nothing new. But instead of asking where this threshold value exceeds the median house price, we can ask (and show in the map below): in relation to this threshold price, what proportion of 2015 sales (using LPI notice of sales data) is affordable to our typical aspiring home owner in each postcode area?

This is a useful measure because we can model the geography of affordability for any household income, as well as chart affordability changes over time for households at that income. For instance, the map below shows Sydney’s affordability geography for a comparable household income (adjusted to $71,700 with NSW wage inflation) for 2005 sales. This map shows something closer to what you would expect to see for a mid-range purchaser: while there are many postcodes where the household could only afford a small proportion of the sales, there are also a number of areas where quite a high proportion would be affordable.

One of the most striking changes between 2005 and 2015 is in the heartland of Western Sydney. While swathes of the more exclusive suburbs have been largely unaffordable for people on this income for over a decade, affordable properties in postcodes beyond Parramatta and Liverpool have also become increasingly rare.

Around Blacktown (postcode 2148), for example, between 60-80% (actually 70-75%) of 2005 sales were ‘affordable’ to a household on $71,700. By 2015, however, between 20-40% (actually 25-30%) of sales in Blacktown were affordable to the equivalent income household. This 45 percentage point decrease, shown in the map below, is typical of Western Sydney. It also aligns with the findings of our recent and more in-depth AHURI analysis which identified similar trends in Sydney, Melbourne and Brisbane: in all three, house prices in low value ‘disadvantaged suburbs’ tended to rise at rates above city-wide norms during the 2001-2011 period.

Another story the maps tell is the loss of the last pockets of affordability in the inner suburbs. In 2005, there were still seven (of 81) postcodes within 10km of Sydney CBD in which at least 40% of sales were ‘affordable’ for this income. In 2015 there were none. Around Summer Hill (postcode 2130), for example, 40-60% (actually 40-45%) of 2005 sales were affordable. By 2015, under 20% (actually 5-10%) of sales were within reach for the equivalent household. This cheapest end of the house price spectrum is much more likely to be small apartments, rather than family houses. This example also shows a deterioration in affordability that would be lost when only considering the median, since even in 2005 under 50% of sales were affordable.

Combined, these two observations mean very few areas remain in Sydney where a proportionate number of sales are affordable to households at this income. A final observation from the maps is that the last sliver of affordability within 20km of Sydney is along the Bankstown train line, through Lakemba and surrounding neighbourhoods. This is notable because the area has been flagged for significant infrastructure investment in the near future. The commuter rail is being converted to metro rail, and there is the presumption of transit-oriented development following it.

This new development will inevitably come with the premium of new construction attached. And the associated urban renewal, improved services and better amenity will likely push up the relative value of existing homes in the area too. Unchecked, this trend could lead to the displacement of existing households, and a classic model of gentrification: whether directly because of insecure tenure, or indirectly as incumbents are marginalised by a changing community. Efforts to moderate or, at least, plan for this change seems lacking from the current planning emphasis on building heights, rail capacity and development viability.

All of this means that, for this income, home ownership (certainly for anything more than a small apartment) within 20km of Sydney’s CBD is likely to almost entirely vanish. Those on this income will be either compromising on what they purchase – the residual cheap properties might still be below the threshold, but aren’t likely to be more than a small apartment – or be left in the rental market or living with their parents. So while this income might have enabled access to home ownership a decade ago, it doesn’t now.

There are limits to the housing affordability analysis presented here, but it is a simple metric that offers a greater degree of insight than measures of median affordability. Plus, we can adjust the boundaries – show suburbs instead of postcodes, or vary the ranges – show a finer grain than the 20 percentage points used here. By drawing on other data sources, it is also possible to cut the sales by dwelling type and size. Or examine advertised rents, or lodged rental bonds, in a similar vein. We will continue to explore its potential as a metric of affordability.


Notes:

[1] In 2013/14, the NSW median gross household income was $81,800. It’s outside the scope of this article, but the ‘typical’ or median household income of home buyers is even more problematic than the typical house price. Most measures will not account for all those not looking to buy a home because they either don’t need to, don’t want to, or don’t have realistic potential to. The figure of $100,000 translates to two earners making around $1,000 per week, which is above the 2015 minimum weekly wage of $640 but below 2015 average weekly earnings of $1,500.

[2] The assumptions are (a) no more than 30% of income goes towards mortgage repayments, (b) the interest rate is 5.0%pa and the loan term is 25 years, and (c) the household has sufficient savings to cover stamp duty and conveyancing, as well as a 20% deposit. These assumptions try to simulate ‘realistic’ conditions, but the savings needed for deposit and stamp duty stand out as atypically high. This is one of the symptoms of low interest rates: a given wage can service a higher loan principal, and so push house prices up. But the period of dropping interest rates in Australia was also accompanied by looser controls on high LVR mortgages (the so-called ‘no doc’ and ‘low doc’ loans), so the higher dwelling price wasn’t translating to a higher deposit in many cases. However, as regulators and lenders have reined in this risky end of the mortgage market, the deposit is now often mentioned as the limiting factor for many potential buyers, not servicing the loan. It is also why questions of stagnating inter-generational social mobility are being asked: is having home-owning parents the only route into home ownership for the next generation?

Where are the shifting tides of population growth in Australia leading us?

Posted by on March 22nd, 2016 · Demographics

By Alison Taylor, Demographer and Research Analyst, City Futures Research Centre

6072665819_37ced08f71_z

Recently released population estimates sank almost without trace. Yet careful scrutiny of the numbers can help explain not only current headlines, but also emerging political and policy issues.

The numbers confirm our begrudging acknowledgement of the end of the mining boom. They reflect our emerging awareness of a realignment in the states’ and territories’ power stakes resulting from relative job opportunities, costs of living and lifestyle options. And they underline the continuing challenges of predicting human behaviour.

As one year ends and another begins and we have time to reflect during our summer holidays, we often consider major changes. Should I move to Melbourne to study graphic design? Will you take the chance and try to find work overseas this year? Isn’t it about time to have that second child you’ve been planning? When will there ever be a better time to retire to the holiday house?

These decisions can be momentous for each of us, but will also impact on the fortunes of the states and territories. It is individual decisions, such as these, that lie behind the aggregate population estimates.

Numbers that are of real consequence. These numbers determine just how the GST cake is shared out by the Commonwealth government to each state and territory administration. Allocations that in turn, allow the states and territories to work out their budgets for the coming year.

Numbers that also describe the pressures being felt particularly in our main capital cities where the growth is concentrated. Pressures that fuel demand for homes, jobs and services. All of which are difficult and costly to provide.

So what can we learn from these recently released numbers?

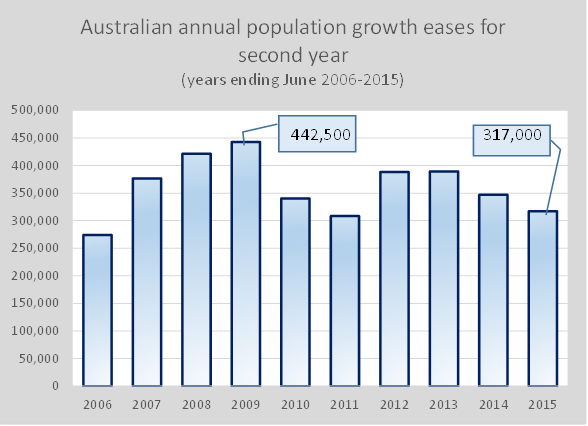
Australia’s population growth peaked in 2008-09 when 442,000 people were added to the population over the preceding financial year. Last year in 2014-15, population growth eased for the second successive year with the addition of 317,000 people to the national population. This means population growth in Australia is currently running at about 28% less than at its peak just six years ago.

dem1

Source: ABS, Australian Demographic Statistics June Quarter 2015, Cat No 3101.0, released 17 Dec 2015

But how is each state performing? With size comes a greater share of that tax cake, yet with growth comes pressures.

Only three jurisdictions grew more than expected based on their share of the Australian population.

By assessing whether each state and territory grew more or less than their respective shares of the nation’s population, we can obtain one measure of performance.

Victoria was the stand-out performer, with 31.3% of Australia’s growth in 2014-15 yet only 25% of the population. New South Wales (NSW) and the ACT also accounted for a slightly larger share of national growth than their respective population shares. All other areas accounted for smaller shares.

Share of population at 2015 and share of growth 2014-15 (percentages)

dem2

Source: Calculated from ABS, Australian Demographic Statistics June Quarter 2015, Cat No 3101.0, released 17 Dec 2015

End of the mining boom

Most of the population impact of the mining boom was felt in Western Australia (WA), Queensland and to a lesser extent, the Northern Territory. Some impacts occurred elsewhere given head office locations and related activity.

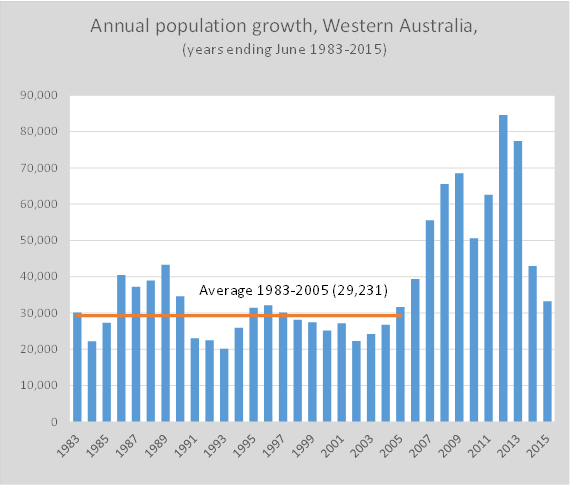
In recent years, WA’s share of national growth climbed dramatically to peak at 21.8% in 2011-12. Queensland saw population growth that represented 23.5% of Australia’s growth in 2011-12. Growth in both states has since slumped with WA only accounting for 10.5% and Queensland 18.6% of national growth in 2014-15.

dem3

Source: ABS, Australian Demographic Statistics June Quarter 2015, Cat No 3101.0, released 17 Dec 2015

In 2011-12, population growth in WA peaked at 84,585 people. By 2014-15, growth had slipped to 33,200 people, just above the long term average prior to the boom (between 1983 and 2005) of 29,200 people each year.


Realignment of the growth generators

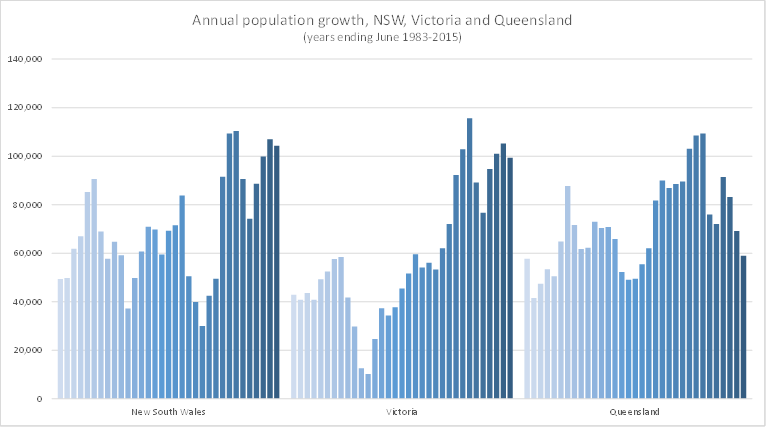
The majority of Australia’s population growth occurs in the three states with the largest existing populations; NSW, Victoria and Queensland. Over the past 30 years, the share of national growth in these three states alone has been as low as 70%, but averages closer to 80%.

In 2011-12 when growth was strong in WA, the big three accounted for just 70.8% of national growth. But by 2014-15, this share had jumped to 82.8% as growth in WA declined.

NSW and Victoria alone currently account for nearly two-thirds of Australia’s population growth, with Queensland growing slower than average.

Patterns of annual population growth vary considerably across the three states. Queensland’s recent growth has been impacted by reduced mining activity investment. This meant less demand for workers in the construction phase of new mines. In 2014-15, annual growth of nearly 59,000 was very similar to the longer term average prior to the mining-led boom that commenced in 2001-02 (average of 60,362 between 1983-2001).

dem4

Source: ABS, Australian Demographic Statistics June Quarter 2015, Cat No 3101.0, released 17 Dec 2015

In contrast, both NSW and Victoria experienced recent growth substantially above historic levels. All three big states experienced a slowdown in growth following 2008-09 as the impact of the GFC was felt. Growth in all three states hit a trough in 2010-11, which was then followed by a recovery. In contrast to NSW and Victoria, Queensland’s growth then eased.

In both NSW and Victoria, growth continued albeit with minor slowdowns in 2014-15. These two states are currently driving Australia’s growth accounting for more than six out of every ten additions to Australia’s population in 2014-15.

Predicting human behaviour

Population growth results from two factors: natural increase when the numbers of births exceed the number of deaths and net migration gains when the numbers of people arriving exceed the number leaving. Of these, natural increase is the easiest to predict as patterns of fertility and mortality are relatively stable, reflecting long-term trends and population age structure.

In contrast, patterns of migration are much more volatile and can change rapidly. The reasons for people moving vary and are difficult to isolate to one driver alone. So while people moved to WA to get work in the mining industry, that move might also have been prompted by unemployment, relationship breakdown or the end of a rental lease.

Economic, social, environmental and even political factors can contribute to such decisions. Thus, it is impossible to suggest that levels of annual population growth can be attributed to single events. And difficult to accurately predict future levels of annual growth or people’s behaviour in any one year.

So will you be making a move this year?

Projections, targets, forecasts and models: how do Sydney’s metro strategies try to anticipate our future housing needs?

Posted by on March 8th, 2016 · Government, Housing, Housing supply

By Laura Crommelin, Laurence Troy and Ray Bunker

As the planning boffins out there will know, Sydney has been the subject of three metropolitan strategies in the past decade – 2005’s City of Cities, 2010’s Plan for 2036 and 2014’s Plan for a Growing Sydney. In a recent working paper, City Futures Visiting Associate Professor Dr Raymond Bunker looked closely at these plans, teasing out what they tell us about the successes and failures of ‘compact city’ planning efforts in Sydney. One of the issues Dr Bunker explores is how these plans address the challenge of providing adequate housing for Sydney’s growing population. This blog post excerpts and expands on a few key elements of this analysis.

The 2005 Plan was the first to clearly espouse the compact city model. Various observers noted that the plan responded to strong developer lobbying (Searle 2006; Bunker 2007), as well as media and public pressure. It proposed that 70 per cent of new dwelling stock be built within the existing urban area by infill and redevelopment, with the other 30 per cent in greenfields growth. The 2005 Plan was accompanied by sub-regional strategies which developed housing targets by Local Government Area (LGA) for additional dwellings to 2031. These were informed by METRIX, an online model which examined the feasibility of locating these additional dwellings in centres as opposed to surrounding areas.

Growth following the 2005 Plan was disrupted by the GFC, the difficulties in redeveloping brownfields sites and the shortage of greenfields areas ready for development. The updated metropolitan strategy of 2010 took much the same approach, aiming to “[l]ocate at least 70% of new homes in existing suburbs and up to 30% in greenfields areas” (p. 7).

However, a change of government in 2011 led to another plan, which eschews any specific targets for greenfields and infill/renewal. Instead, the 2014 Plan concedes that some aspects of the housing market are outside government control, and focuses more on feasible development. While the plan does still contain an overarching housing target for 2031, it offers a more pragmatic perspective than the visionary long-term prognoses of the earlier plans, as “[t]he private sector will only develop housing on rezoned sites where there is sufficient consumer demand for it, at a price that provides a return to the developer” (p. 66).

Accordingly, the plan identifies areas with potential additional housing capacity, but then uses an Urban Feasibility Model to test development options for each subregion. It proposes setting five year housing targets with local councils to maximise the opportunities for growing housing supply. This is a shift from the longer-term sub-regional housing targets set under the 2005 and 2010 Plans.

So what can be gleaned from the more recent plans about how the provisions of the 2005 Plan have fared? There is little in the later plans about how the earlier targets have tracked, although there is a 2014 Property Council publication called Missing the Mark, which suggests that housing construction has failed to achieve the ambitions of the 2005 Plan.

Table 1 (below) shows the additional dwelling targets for each sub-region as derived from the 2005 Plan (p.18) and 2010 Plan (p.115). While the targets cannot be exactly compared as they are for slightly different time periods, they do show some wide variations in the additional subregional housing targets set in the two plans. The final column shows further variation in the dwelling projection figures released in 2013, which appear to have informed the total housing target of 664,000 cited in the 2014 Plan (p.65). It is important to note, however, that the 2013 figures are projections, not targets, and “do not necessarily reflect policy positions and may well differ from policy targets expressed in the Planning and Environment’s Metropolitan and Regional Strategies” (Department of Planning & Environment 2014b, n.p.).

Subregion 2005 Plan: 2004-2031 Targets 2010 Plan: 2006-2036 Targets 2013 Data: 2011-2031 Projections[1]
Central 55,000 61,000 53,700
East 20,000 23,000 32,650
South 35,000 58,000 76,500
Inner West 30,000 35,000 34,650
Lower North Shore 30,000 44,000 48,300
North 21,000 29,000 30,650
North East 17,300 29,000 26,250
West Central 95,500 96,000 102,550
North West 140,000 169,000 150,500
South West 155,000 155,000 108,550
Total 598,800 699,000 664,300

Table 1: Additional dwelling targets by sub-region in 2005 & 2010 Plans; dwelling projections by sub-region in 2013 Data


To explore this data further, a detailed table in the working paper breaks down the 2005 targets and the 2013 projections by LGA, and provides annualised figures to address the different time periods covered (see Table 2 on Page 8 of the working paper). While still an imperfect comparison, the juxtaposition of these two sets of housing figures raises important questions about the relationship between the setting of housing targets and the actual operation of the private sector in delivering new dwellings, while emphasising the growing dwelling needs to 2031.

For a more blog-friendly representation of the data set out in Table 2, CF Research Associate Dr Laurence Troy has developed interactive maps showing these annualised 2005 and 2013 figures, and the percentage difference between them. Click on specific LGAs in the maps to see the exact numbers. Obviously, the same disclaimers about comparability also apply to these maps, but they nonetheless tell an intriguing story about the shifting development expectations for various parts of Sydney over the past decade.

The first map, which shows the 2005 Plan housing targets, places much of the emphasis on delivering new dwellings in the two major growth centres in Western Sydney. The expectation in this strategy was that the inner west, eastern suburbs and lower north shore would have a much smaller role in delivering on housing targets. The City of Sydney is the exception, largely driven by the impacts of major developments in Green Square.

The second map, showing the 2013 projections, maintains the level of dwellings in the Western Sydney growth areas, but also increases the contributions expected of inner areas.

The final map (at the top of this post, and below) shows the percentage change in dwelling targets across the two plans, and suggests a renewed emphasis on inner zones, from the inner west through to Sutherland. It is particularly interesting to note the decline in dwelling targets from already low values in Strathfield and Burwood, despite both areas being part of the Parramatta Road corridor, which is the focus of major strategic planning in connection with the WestConnex road project.

Ultimately, however, perhaps the most interesting story here is the complexity involved in collating and comparing housing figures across the different plans. This highlights the need for more adequate explanation of what housing targets, projections and forecasts mean in various planning documents, and how they relate to one another. This complexity also demonstrates the drawbacks of Sydney’s planning landscape, which has been shaped by a lack of continuity and strong influence by various interest and lobby groups. On this point it is useful to compare the situation in Perth, where a centralised planning agency with bi-partisan support has been in place for decades. The planning outcomes are quite different, and will be explored in a forthcoming working paper by Dr Bunker, due out in early March. Be sure to check back here for its release.

Notes:

[1] These projections were released by LGA; they have been aggregated here in line with the sub-regional structure used in the 2005 and 2010 Plans. The original data is available at: http://www.planning.nsw.gov.au/projections.