By Prof Hal Pawson. A version of this story was originally published in The Conversation. Read the original version here.
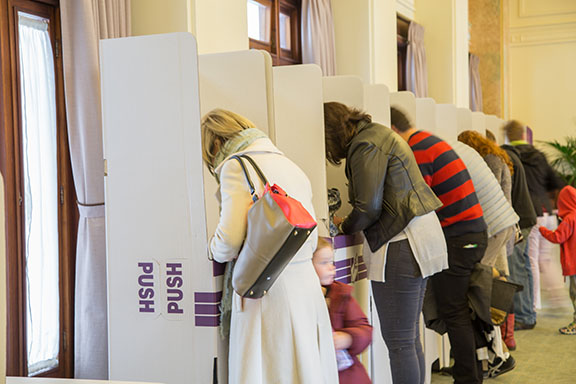
Despite its prominence in the election, housing affordability campaign debate remained largely one-sided. Plenty was said about the very real challenges faced by first home buyers and by homeowners already mortgaged to the hilt. But relatively little comment focused on the cost-of-living predicament faced by low income renters – or on the policy measures that might help to relieve this.
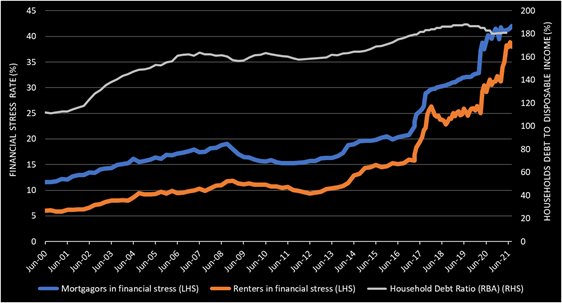
Rental stress is the situation where a tenant’s housing costs leave not enough remaining income to cover basic household essentials. This is officially estimated as affecting two thirds of the low-income private tenant population which totals around a million households. So failing to pay proper attention to this issue is a serious political and media oversight.
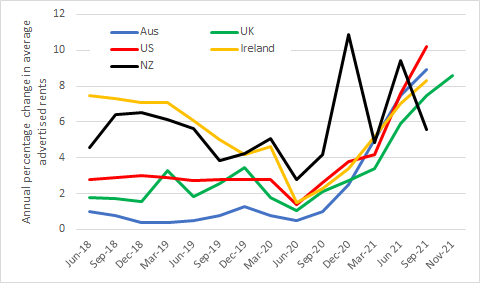
And across Australia, but especially in the regions, the past two years have seen rents rising at rates unseen in more than a decade. However, this only compounds the much more longstanding trend of growing demand pressure at the lower end of the market.
Recent indications of growing system stress
As calibrated by waiting list applications, these processes look to have been recently inflating social housing demand. In the three years to 2021 overall applicant numbers rose by 16%, Australia-wide, to 164,000 households. Nationally, annual ‘new greatest need applications’ (mainly people experiencing homeless or under threat of homelessness) grew by 48% over this period, suggesting a significant spike in demand.
As revealed by our new research, intensifying stress on the New South Wales social housing system can be seen in that the proportion of total lettings to highest priority applicants increased from 41% to 60% in the six years to 2020-21. One outcome will be substantially lengthening wait times for income-eligible, but non-priority, social housing applicants.
Similarly in Queensland, not only did waiting list numbers grow by 78% in the four years to June 2021 (to some 28,000 households), but average waiting time for registered applicants increased by 83% (to 2.4 years).
Dwindling social housing supply
Growing stress on social housing also reflects inadequate supply – usually calibrated with reference to the near stagnation in public and community housing dwelling numbers in twenty-first century Australia, at a time of rapid population growth. But by analysing the social housing system in terms of flows, rather than stocks, it can be concluded that system capacity has been cut by more than half over the past 30 years. As we report, just under 30,000 new applicants were granted a social housing tenancy, Australia-wide, in 2020-21. That compares with 52,000 in 1991 – a 42% reduction. But proportionate to population, the latest figure is 61% down.
This is attributable to two factors. First, with new build rates reduced to minimal levels over the past decade, only very small numbers of homes become available for letting each year in this way. Second, with the social rental sector accommodating an increasingly disadvantaged population cohort, and with what has become a yawning cost gap between social and private housing, the scope for existing tenants to ‘advance their housing career’ by moving into market housing is hugely diminished by comparison with the historic situation.
A ‘silted up’ social housing system is a low tenancy turnover sector that generates few social mobility-generated vacancies available for letting to new applicants.
Investigating the paradox
As regards demand, however, analysis over a longer timeframe reveals something of a paradox. Despite recent increases, the longer-term trend of social housing waiting list numbers has remained largely flat – 2021 registrations barely exceeded the number for 2006. This, despite substantially increased housing need as evidenced by trends in homelessness, rental stress and other indicators.
Our research reveals some of the likely explanations for this apparent contradiction. Most importantly, social housing waiting lists nowadays see high rates of ‘churn’, with large cohorts of applicants newly registering each year paralleled by substantial numbers exiting lists without gaining a social housing tenancy.
Quantifying these processes, we draw on unpublished statistics for New South Wales where 30 June 2021 waiting list applications totalled nearly 50,000. Our evidence suggests that during 2020-21, over 6,000 registrations were cancelled or withdrawn, in addition to the 12,000 ended via a social housing tenancy allocation.
In part, this pattern likely reflects the realisation by many non-priority applicants that the prospect of a tenancy offer is remote. After all, for those needing a 3-bedroom property, the NSW Government itself projects typical waiting times for such applicants as exceeding 10 years in 17 of its 25 Sydney letting areas. Also probably implicated is rigorous waiting list management practice, with registrations deleted when an applicant (intentionally or otherwise) fails to reconfirm their eligible status and interest.
Limiting social housing eligibility
Restricting eligibility to register for social housing is central to the rationing of this scarce resource in Australia; in particular, through income limits. As revealed in our report, allowable income maxima vary substantially across the country, and in most jurisdictions the 2021 income limit for a single person was below the current minimum wage (assuming full-time employment).
Moreover, weekly income limits defined by the Queensland and West Australian governments ($609 and $450 for single adults in 2021, respectively) have remained static or almost unchanged for more than a decade – managing demand by effectively tightening applicant eligibility over time.
The rationing challenge
We may debate the ways that social housing waiting lists are managed, and some of the policy choices involved, but it has to be accepted that state and territory government staff face unenviable challenges in rationing a static or shrinking resource at a time of continuing growth in need.
This situation has arisen mainly because Australia’s routine national public housing construction program that ran for 50 years until 1996 was effectively ended by the Howard Government at that time.
The incoming Labor Government has pledged a six year scheme to construct 30,000 new social and affordable rental homes. This will be greatly welcomed by advocates representing disadvantaged groups. But to have any significant impact in relieving low income housing stress, this will need to be both expanded in scale and maintained for the long term.
Otherwise, the challenge faced by state and territory governments in rationing scarce social housing will become tougher still.