By Prof Susan Thompson, Liz King, Jan Fallding and Nicola Groskops. Originally published in New Planner, the journal of the Planning Institute of Australia (NSW Division).
Increasingly communities are rightly demanding a built environment that makes it easy for everyone to be healthy and well as they go about their daily activities. This is related to growing understandings about the critical health supportive role of the places where we live, work, play, and how we travel from one to the other. COVID-19 has sharpened our collective focus on this issue, particularly the importance of local neighbourhood public spaces, walking paths, cycleways and green parkland for good health and wellbeing.
Being outdoors for recreational pursuits is germane to the Australian culture. Physical activity is very much a part of this, as is the infrastructure to facilitate different recreational pursuits. The research evidence is strong on the benefits of regular physical activity for good health, particularly in reducing the major risk factors for chronic physical and mental conditions. Being active with others importantly connects us socially, which underpins wellbeing, and has been a challenge during the Pandemic.
And while the outdoors is an ideal place for all Australians to engage in vital health supportive behaviours, it is somewhat ironic that it can be deadly! Time spent in the open air potentially puts us at risk of skin cancer, the most common cancer across the nation.
Skin Cancer
We know that overexposure to the sun’s ultra-violet radiation (UVR), which is a carcinogen, causes skin cancers, including both melanoma and non-melanoma skin cancer types. Australians have the highest rate of melanoma in the world – the most dangerous form of skin cancer. Two in every three Australians are expected to develop skin cancer before the age of 70. Between 2013 and 2017, 80 of 128 local government areas (LGAs) in NSW had an age-standardised incidence rate of melanoma above the NSW average (52.3 per 100,000 population). The Cancer Institute NSW has a comprehensive statistics web portal where you can find melanoma age-standardised incidence rates by LGA. Across NSW, UVR levels of three and above are high enough to damage unprotected skin for at least 10 months of the year. Unlike temperature, UVR cannot be seen or felt and alarmingly, damage to unprotected skin can still occur on cool and/or overcast days.
Shade
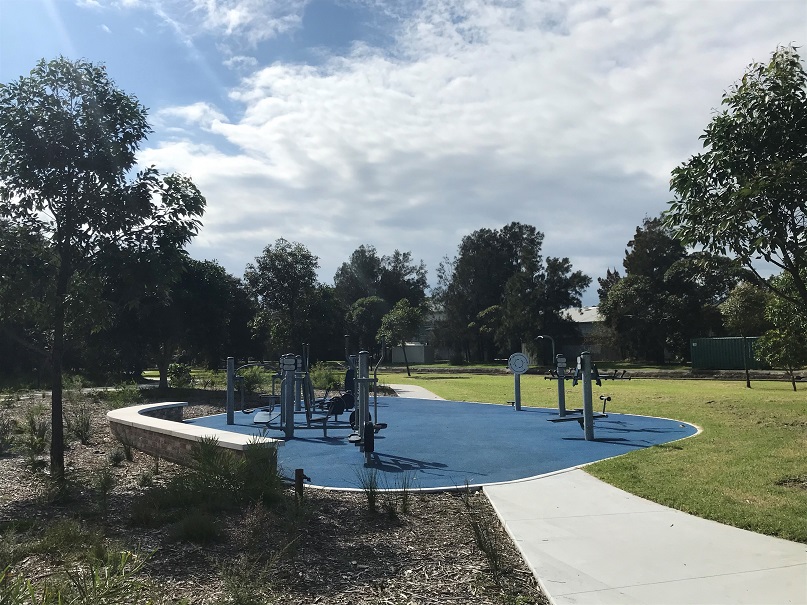
The good news is that skin cancer is highly preventable. Personal protective behaviours are essential. These include wearing appropriate clothing, wide brimmed hats and sunglasses, and applying sunscreen. In addition, it’s important to seek out shade when UVR levels are high. There is evidence that well-designed and correctly positioned shade, from both natural vegetation and built structures, can reduce exposure to UVR by up to 75 per cent. The provision of good quality shade is particularly important in spaces such as playgrounds, frequented by children and adolescents. It is in these younger years that vulnerability to UVR is especially high and over exposure to the sun at this time of life can result in deadly skin cancers in later years. When shade is provided, people use facilities that are protected. The provision of shade will ensure that communities can safely use outdoor facilities in summer to keep fit and avoid skin cancer. So, the outdoor gym, no matter how well equipped, will be abandoned in hot weather if it is not adequately shaded (see below). It’s also important to note equity issues here as Cancer Council NSW research has found that those living in lower socio-economic areas have less access to playgrounds with adequate shade.
Getting critical infrastructure in place – the co-benefits of shade
The health evidence is unequivocal – shade is critical infrastructure in providing a health supportive environment for the entire community across the life course. But it’s not just about UV protection – there are many other benefits of shade which strengthen the case for its installation. Environmental benefits include lowering urban heat, as well as reducing air pollution, water evaporation, soil erosion and storm water run-off. The maintenance of animal habitat and biodiversity is also enhanced and energy usage and associated costs can go down. Social and economic benefits encompass reducing neighbourhood crime as more people are out and about connecting with each other and activating the streets, commercial areas and public places. All-in-all this results in places that people want to frequent, which is a positive outcome for the entire community. For a very accessible summary of the multiple benefits of shade which can be used with lay and professional audiences alike, download ‘Shade; A planning and design priority that helps prevent skin cancer’.
Getting critical infrastructure in place – guidelines to assist
Planners have multiple roles to play in ensuring that the communities’ demands and needs for a healthy built environment are met. Shade is a critical piece of infrastructure supporting healthy behaviours in the hot and sunny Australian outdoors. Planners can find a wealth of resources to actively advocate for the provision of shade for public and private developments.
At the local level, the Cancer Council NSW’s ‘Guidelines to Shade’ is a practical and informative tool for planners and developers. Local Strategic Planning Statements (LSPSs) can also incorporate specific text strategising appropriate shade installation. Example LSPS provisions are available and a recent report for the Cancer Institute NSW documents how councils actually incorporated the consideration of shade in their LSPSs. This research can assist councils when revising their Statements and preparing future planning policy.
At the state level we are seeing a strong focus on integrated design policy for the built environment under the Government Architect’s ‘Better Placed’ integrated design framework. This includes the use of green infrastructure as a core element, as well as putting health and wellbeing at the centre of good placemaking. While the importance of tree canopy for shade to protect against overexposure to sunlight is acknowledged in ‘Greener Places’, shading for UV protection requires greater emphasis and direct referencing to better promote its uptake. The soon to be produced Design and Place SEPP by DPIE provides a great opportunity to do this. All five principles of the intended SEPP would benefit from the inclusion of either natural or built shade as key strategies to achieve their objectives.
Conclusion
Quality natural and built shade for UV protection is an essential part of health supportive infrastructure for all members of the community. Shade has multiple benefits in public and private settings and needs to be embedded in planning policies and strategies at all levels of governance.
About the authors
We are all members of the NSW Shade Working Group (SWG) collaborating together across health and the built environment. The SWG is auspiced by the NSW Skin Cancer Prevention Strategy led by Cancer Institute NSW.
Susan Thompson, FPIA and Sydney Luker Medalist, is Professor of Planning and Head, City Wellbeing Program, City Futures Research Centre at UNSW. She is a passionate advocate for healthy built environments and the role that planners can play in supporting health and wellbeing for all.
Liz King is Manager, Skin Cancer Prevention Unit, Cancer Council NSW. She has a strong background in public health planning and service delivery, and is a passionate advocate for the integration of UV protection policies into planning design and practice.
Jan Fallding RPIA (Fellow) is a self-employed strategic and social impact planner based in the Hunter Valley.
Nicola Groskops is a public health professional working to prevent cancer with the Cancer Institute NSW (NSW Health) and is passionate about improving the conditions in which people live, work and play.

.png)