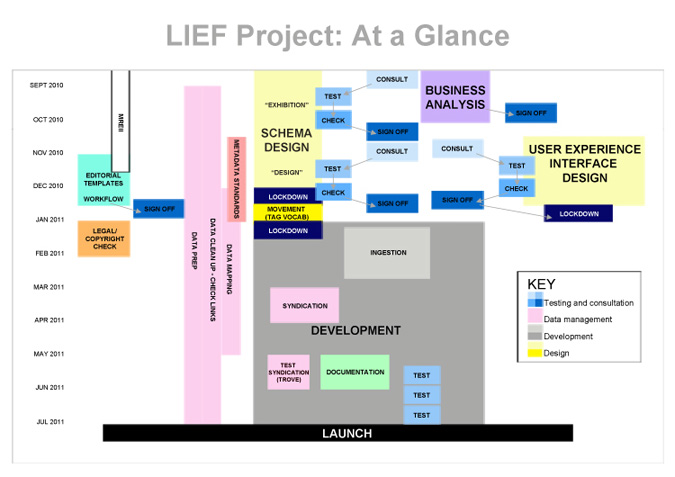
This diagram represents an overview of the schedule, major components and milestones of the Project. It is a gantt chart in box form. As the project progresses, various little elements will change within it as we learn more – but the critical path should not change.
Project Map: at a glance 1.0
Posted by gillianfuller on Friday, September 3rd 2010
Categorized in Uncategorized
Recent Posts
Archives
Tags
-
agile art history Australian Art Australian art history Bernard Smith bookmarking collaboration community conferences consultation Content contribute Craft crowdsourcing data Datamanagement datamigration design diagrams digitalHumanities feedback Feminism fun import library look&feel maps metadata new media art obituaries office party matching projects research schema scholarship social media Sydney Biennale University of Melbourne Special Collections Collaboration user experience Visualisation visualization WA whiteboard youtube
WP Cumulus Flash tag cloud by Roy Tanck and Luke Morton requires Flash Player 9 or better.

